Automated Incorporation of Pairwise Dependency in Transcription Factor Binding Site Prediction Using Dinucleotide Weight Tensors
Abstract
Gene regulatory networks are ultimately encoded by the sequence-specific binding of (TFs) to short DNA segments. Although it is customary to represent the binding specificity of a TF by a position-specific weight matrix (PSWM), which assumes each position within a site contributes independently to the overall binding affinity, evidence has been accumulating that there can be significant dependencies between positions. Unfortunately, due to various methodological challenges, there is currently still no model that incorporates such dependencies in a way that is both general and practical. On the one hand, simple models that only consider nearest-neighbor interactions are easy to use in practice, but fail to account for the distal dependencies that are observed in the data. On the other hand, models that allow for arbitrary dependencies are prone to overfitting, requiring regularization schemes that are difficult to use in practice for non-experts.
Here we present a general model for TF binding specificity, called dinucleotide weight tensor (DWT), that implements arbitrary pairwise dependencies between positions in binding sites, rigorously from first principles, and free from any tunable parameters. We implemented a tool-box, available at dwt.unibas.ch, that allows users to automatically perform ‘motif finding’, i.e. the inference of DWT motifs from a set of sequences, binding site prediction with DWTs, and visualization of DWT ‘dilogo’ motifs. We demonstrate the power of the method on a large set of ChIP-seq data-sets, showing that DWTs never overfit, and significantly outperform PSWMs for a substantial fraction of TFs. In addition, we show that the dependencies inferred by the DWTs from ChIP-seq data are corroborated by HT-SELEX data for the same TF, suggesting that DWTs capture inherent biophysical properties of the interactions between the DNA binding domains of TFs and their binding sites.
1Introduction
Gene regulatory networks are a crucial component of essentially all forms of life, allowing organisms to respond and adapt to their environment, and allowing multi-cellular organisms to express a single genotype into a large number of different cellular phenotypes. Transcription factors (TFs) are central players in gene regulatory networks that bind to DNA in a sequence-specific manner. Although the molecular mechanisms through which TFs regulate expression of their target genes involve a complex interplay of interactions between TFs, co-factors, chromatin modifiers, and signalling molecules, gene regulatory networks are ultimately genetically encoded by constellations of transcription factor binding sites (TFBSs) to which the TFs bind in a sequence-specific manner.
Consequently, a key question in the analysis of gene regulatory networks is to find a proper mathe-matical representation of the sequence-specificities of TFs. That is, for each TF, we want to obtain an energy function E(s) that calculates, for any given DNA segment s, the binding free energy of the TF binding to s. The segment s is generally of fixed length for a given TF, which typically ranges from 6 to 30 base pairs. Although there have been some attempts to use direct structural and biophysical modeling of the sequence-specificity of TFs, e.g. Paillard & Lavery, 2004Endres et al., 2004Morozov et al., 2005, such efforts have generally achieved only limited accuracy.
Instead, by far the most commonly approach to representing the sequence-specificity of TFs is through a statistical mechanical analysis, which essentially assumes that the probability that a binding site for a particular TF has sequence s is given by a maximum entropy distribution with respect to its binding energy E(s), i.e. P(s) ∝ eλE(s) Berg & Hippel, 1987Nimwegen, 2007. Using this assumption, the binding energies E(s) of sequence segments s can in principle be inferred from data on the relative frequencies P (s) with which different sequences s are bound by a given TF. However, the number of possible sequence segments s is 4l, which is already over a million for relatively short TFBSs of length l = 10 base pairs, i.e. generally larger than the total number of genome-wide binding sites for a single TF. Thus, a crucial additional assumption, that has been made for several decades Seeman et al., 1976, is to assume that each base pair in the binding site contributes independently to the overall binding energy, i.e.


With the drastic reduction in costs of DNA sequencing over the last decade and the development of a number of experimental techniques for identifying TFBSs in high-throughput, such as ChIP-seq Johnson et al., 2007, protein binding arrays Mukherjee et al., 2004, and HT-SELEX Ogawa & Biggin, 2012, hundreds if not thousands of example TFBSs for a single TF can now be routinely obtained. Such large collections of TFBSs have enabled researchers to investigate to what extent the assumption of independence, i.e. that each position in the binding site contributes to the binding energy independent of the other positions, holds in practice. The results of these investigations indicate that, although the assumption of independence is often reasonably accurate, there are also many cases which clearly deviate from independence.
Studies going back over a decade, such as Man & Stormo, 2001Bulyk et al., 2002, had already provided evidence that PSWMs can be unsatisfactory in describing DNA binding specificities of particular TFs, and that the assumption of independence often breaks down. More recently, a large-scale study by Bulyk and colleagues assayed 104 distinct mouse TFs using protein binding microarray (PBM) technology and found that, for a large fraction of the TFs investigated, the binding energy landscapes were significantly more complex than assumed by PSWM models Badis et al., 2009. Notably, a number of assayed TFs exhibited strong support for pairwise dependencies (PDs) within their binding sites. As another example, Nutiu et al. Nutiu et al., 2011 studied the binding specificity of the yeast TF Gcn4p in detail and showed that it exhibits several strong PDs. Moreover, a model that incorporates these PDs was shown to outperform PSWM models in explaining the observed TFBSs. In summary, all these results suggest that accurate representation of TF sequence-specificities requires that dependencies between positions are taken into account, although it remains unclear how important such dependencies are for the acuracy of TFBS prediction.
1.1Incorporating pairwise dependencies
Several works have modeled TF binding specificity by including dependence between binding positions. A major challenge is that, when an arbitrary number of dependencies between arbitrary pairs of positions is allowed, the number of possible models and parameters grows rapidly, so that it becomes difficult to reliably identify the best models, and to avoid overfitting. Previous works have taken different approaches for addressing this challenge.
In some approaches, model complexity is directly controlled by only allowing dependencies between neighboring positions, e.g. Siddharthan, 2010Mathelier & Wasserman, 2013. However, previous analyses indicated that substantial dependencies can occur between more distal pairs of positions, and our analysis below also indicates that significant dependencies between non-neighboring positions are common.
In other approaches, PDs between arbitrary pairs of positions are in principle allowed, but instead of incorporating all possible pairwise dependencies, different ad hoc approaches are employed to restrict the number of PDs that are taken into account. For example, a Bayesian network model by Barash et al. Barash et al., 2003 starts by calculating likelihoods for all possible PDs, finds the spanning tree of PDs that has maximum likelihood (ML), and then models the TF binding specificity using only the PDs in this ML spanning tree. That is, of the l(l − 1)/2 possible PDs, only (l − 1) end up being used for modeling the TF binding specificity.
Alternatively, some approaches start from a model without dependencies, and use a greedy algorithm that iteratively adds PDs which maximally improve the model. For example, Sharon et al. Sharon et al., 2008 express the TF’s binding specificity as a weighted sum of features, where features are binary statements such as that a specific pair of nucleotides appears at a particular pair of positions. Features are iteratively added to the model until no additional feature can be found that further improves the model. However, this iterative procedure often leads to overfitting and Sharon et al. used a combination of regularization procedures to control model complexity.
A similar iterative approach is used in the work of Santolini et al. Santolini et al., 2013 where the TF binding specificity is modeled by an inhomogeneous Potts model, which incorporates information from both single and pairs of positions. Individual pairs of positions are iteratively added to the model so as to maximize its likelihood. Here too the authors find that this procedure can easily lead to overfitting and they use the Bayesian information criterion as a regularization scheme to penalize model complexity.
In spite of these efforts, no model that incorporates PDs has found widespread application in the community so far. Models that only use nearest-neighbors are attractive for their simplicity, but fail to capture the distal PDs that are clearly evident in the data. In contrast, models that consider arbitrary PDs make use of ad hoc approaches to restrict the number of PDs considered, and employ complex regularization schemes that require expert supervision, which make them harder to use in practice. The current challenge is thus to develop a model that, on the one hand, rigorously incorporates all possible PDs, and that is easy to use in practice, i.e. not requiring expert tuning of parameters or control of model complexity, on the other hand.
Here we present a new Bayesian network model, called dinucleotide weight tensor (DWT), which rigorously takes into account all possible PDs within a rigorous probabilistic framework that has no tuneable parameters and automatically avoids over-fitting. In particular, in the DWT model all unknown parameters including the topology of the network of direct interactions and the joint probabilities for all dependent pairs of nucleotides within the network are analytically marginalized over, so that binding energies E(s) that take all PDs into account can be calculated from first principles, and in a parameter-free manner. This makes the DWT model highly robust and easily applicable in practice, i.e. even when there are no significant PDs. Indeed, in addition to presenting the algorithm below, we have also developed a suite of software tools that can be used to perform motif finding with DWTs, visualization of DWT motifs, and TFBS prediction with DWTs, which we make publically available with this publication.
We demonstrate the power of the DWT approach using a large collection of ChIP-seq data-sets for 78 different human TFs. We show that DWTs always perform at least as well as PSWMs, demonstrating that DWTs automatically avoid over-fitting, even though there are no explicit regularization schemes. Moreover, DWTs clearly outcompete PSWMs for a substantial fraction of TFs. Finally, using HT-SELEX data for a set of TFs for which ChIP-seq data are also available, we show that the DWTs inferred from ChIP-seq data also generally outcompete PSWMs on HT-SELEX data. Since the HT-SELEX experiments are performed in vitro using only the DNA binding domains of the TFs, these results suggest that the DWT likely captures aspects of the biophysical interaction between the DNA binding domains of the TFs and their cognate binding sites.
2Results
2.1The Dinucleotide Weight Tensor model
We here present the dinucleotide weight tensor (DWT) model for describing TF sequence-specificities using arbitrary pairwise dependencies. The DWT model is based on a Bayesian network model that we have applied previously to model interactions between proteins Burger & Nimwegen, 2008 and to predict contacting residues within three-dimensional protein structures Burger & Nimwegen, 2010. The model describes the probability distribution P (s) of binding site sequence segments s as a mixture of all possible factorizations of the joint distribution over s into pairwise conditional probabilities between pairs of positions in s.
Let S denote an ungapped alignment of sequences of a given length l, that are hypothesized to correspond to a collection of binding sites for a common TF. A central quantity in probabilistic motif finding is the probability P (S) that this collection of sequences derives from a common PSWM w. Under the assumption of independence that the PSWM model makes, the probability P (S) is given by a product of the probabilities P (Si) for the individual alignment columns
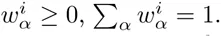


Here we generalize the PSWM model by assuming that arbitrary pairwise dependencies can occur between pairs of positions. In complete analogy with the calculations for the PSWM above, we can introduce a dinucleotide weight tensor w for the pairs of positions (i, j), with components


The evidence for dependency in the frequencies of letters at positions (i, j) can be quantified by the likelihood ratio Rij:

In contrast to the PSWM model, we do not assume that the probability P (S) simply factorizes into independent probabilities P (Si) for each column i. Instead, we will approximate the joint probability P (S) as a mixture of all possible factorizations into pairwise conditional probabilities of the form P (Si|Sj)P (Sj|Sk)P (Sk|Sm)…. For any such factorization, there is a single ‘root’ position that is not dependent on any other position, and each other position i is dependent on one ‘parent’ position π(i). If we consider each position i a node of a graph, and draw an edge between each node and its parent node π(i), then each possible factorization π corresponds to a spanning tree of the set of l nodes. Noting that the conditional probability P (Si|Sj) of column i given column j can be written as P (Si|Sj) = RijP (Si), we obtain for the probability P (S|π) of the alignment given a particular factorization π:

Instead of assuming one particular factorization π, we consider all possible factorizations and explicitly marginalize over the unknown factorization. That is, we aim to calculate
Specifically, the Laplacian L(R) of matrix R is obtained by replacing, for each row i, the diagonal element Rii = 0 with minus the sum of the entries on the row, i.e.

The determinant D(R) can be calculated efficiently, i.e. in O(l3) steps. One complication in practice is that, when there are many sequences in S, the elements of R may vary over many orders of magnitude, causing the numerical calculation of the determinant to become unstable. As far as we are aware, there is no rigorous procedure to ensure numerical stability, and we use an ad hoc approximation which involves raising all elements of R to a power, such that the overall range of the values is reduced (see supplementary material).
2.2Binding site prediction with DWTs
We first briefly review binding site prediction using PSWMs. Assume a set of known TFBSs S for a particular TF is given. To predict new TFBSs for this TF one calculates the probabilities P (s|S) that, sampling another sequence from the same PSWM that the set S derives from, one would obtain sequence segment s. This probability is given by the ratio of the probability P (s, S) that all sequences derive from a common PSWM and the probability P (S) that the sequences in S derive from a common PSWM.
Using equation (2) we have


These calculations generalize in a straight-forward manner to our DWT model. The probability to sample sequence segment s from the same DWT model as the set S is given by

Whereas the probabilies P (s|S) for the PSWM model depend only on the counts


2.3Motif finding with DWTs
To infer a DWT model from a set of sequences that are known to contain binding sites for a common TF we use an expectation maximization (EM) algorithm analogous to those used for inferring PSWMs Bailey & Elkan, 1994.
The DWT inference algorithm takes as input a set of sequences S and an initial PSWM w. That is, we will initialize the DWT from a PSWM that can either be specified by the user, e.g. when a known PSWM motif is already available for the TF in question, or it can be obtained by running a standard PSWM motif finder on the input sequences S. The sequences in the set S are generally longer than the length l of the motif but typically not longer than a few hundred base pairs, e.g. they could consist of the binding peaks obtained in a ChIP-seq experiment.
We use the given PSWM w to predict a set of TFBSs in the input sequences S and initialize the DWT model M by calculating the pair counts


At each round, given a current DWT model M, we first maximize the likelihood L(M, c) with respect to the concentration parameter c. Using the optimal concentration parameter c∗m we then calculate, for each segment s, the posterior probabilitiy P (M |s) that s is a site for the motif:

We select all sequences s for which P (M |s) ≥ 0.5 and calculate new pair counts


2.4Dilogos graphically represent DWT models
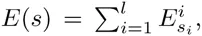
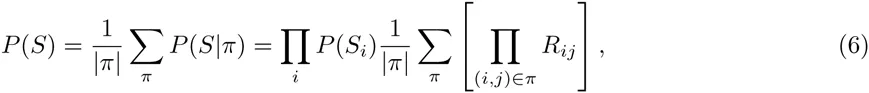
To visualize DWT models, we propose a graphical representation which generalizes the well-known se-quence logo and which we call a ‘dilogo’. For example, Fig. 1 shows the dilogo for the TF NFKB1, which we constructed from ChIP-seq data (see below).
The dilogo first of all shows the classical sequence logo representation of the marginal probabilities

Because it is unwieldy to show the conditional probabilities P (si|sj) for all pairs of positions (i, j), we select a set of pairwise dependencies that are jointly consistent with a single factorization of the probability P (S) as follows. We list all pairwise dependencies P (i, j), sorted from highest to lowest probability, and go down the list, adding pairwise dependencies as long as the resulting graph does not contain any loops. The resulting graph of dependencies is shown above the square with posterior probabilities. In this example, position 11 depends on position 1, position 10 depends on position 11, position 9 depends on position 8, and so on.
Finally, for those positions i that are dependent on another position j, the conditional probabilities P (si|sj) are shown in sequence logo format with one sequence logo (rows in the figure) for each possible state of the parent letter sj (shown on the left of the figure). For example, in the NFKB example, the letter at position 8 depends on the letter at position 4. If position 4 shows an A, position 8 is almost certain to show a C. However, when position 4 shows a G or T, position 8 is roughly equally likely to show a T or C. When position 4 shows a C, position 8 is roughly equally likely to show any of the 4 letters.
To enable easy application of DWT models in motif finding we have made a tool-box with software available for motif inference with DWTs, prediction of TFBSs using DWTs, and visualization of DWT models using dilogos. Source code and executables can be downloaded from Github. In addition, to make DWT analysis available to users that are less computationally savvy, we are also making TFBS prediction and motif inference with DWTs available through a web-interface at dwt.unibas.ch. Here the user only has to provide a set of DNA sequences and an initial motif guess (in the form of a PSWM), after which the DWT motif finding, TFBS binding site prediction, and dilogo visualization will all be performed automatically.
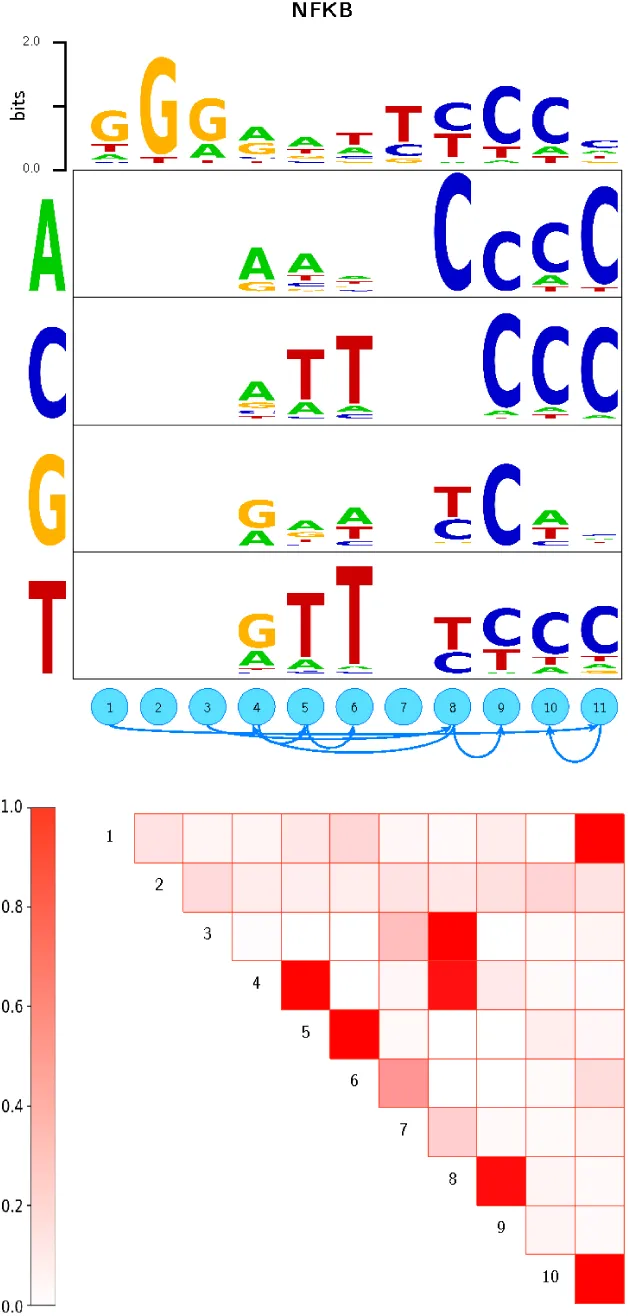
Figure 1:Dilogo for the motif of the TF NFKB.
The top row of the dilogo shows the normal sequence logo representation of the marginal probabilities wi for each of the letters α at each position i. The posterior probabilities for dependency between each pair of positions are shown in the square lattice at the bottom of the dilogo, with darker red color indicating higher probability of dependence. Above this square lattice a graph with significant pairwise dependencies is shown: an arrow from node j to i indicates that the probability of a particular letter at i depends on the letter appearing at j. Finally, for each position i that significantly depends on another position j, the probabilities P (si|sj) are shown in sequence logo format, with each row corresponding to the identity of the parent letter sj and each column showing the probabilities P (si|sj) for the child letter si.
2.5DWT models outperform PSWMs on ChIP-seq data
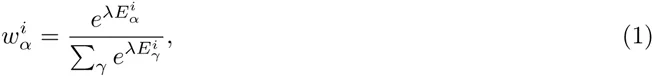
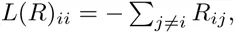
To compare the performance DWT models with the performance of standard PSWM models, we analyzed a large set of ChIP-seq data-sets for 78 different human TFs from the ENDOCE consortium ENCODE-Project-Consortium, 2012. The general setup of our performance comparison is shown in Fig. 2. We processed each of the ChIP-seq datasets using CRUNCH, an integrated ChIP-seq analysis pipeline that we developed in-house and that includes automated PSWM motif analysis Berger et al., 2016. CRUNCH returns a list of binding peaks, which are typically 100 − 300 base pairs in length each, ordered by their significance. For each data-set, we selected the top 1000 binding peaks. The peak sequences were randomly divided into two subsets of 500 sequences, one of which will be used as a training set to fit both a PSWM and DWT motif, and one for testing the performance of the fitted motifs. As part of its motif analysis, CRUNCH extracts orthologous sequences from 6 other mammalian species for each peak sequence and multiply aligns these using T-Coffee Notredame et al., 2000. The motif finder PhyloGibbs Siddharthan et al., 2005 is then run on these alignments to infer PSWM motifs. CRUNCH further refines these motifs on the multiple alignments of the training sequences using MotEvo Arnold et al., 2012. We use the top motif returned by CRUNCH as an initial PSWM motif in our analysis and obtained its TFBS predictions on the peak sequences. As an example, Fig. 2b shows the initial PSWM motif inferred for the TF CEBPB.
Using this PSWM as a starting motif we then iteratively fitted a PSWM and a DWT motif on the training sequences (Fig. 2c). The DWT model was fitted using the EM procedure described in the section on motif finding with DWTs above. In order to compare DWTs and PSWMs on equal footing, a PSWM was fitted on the same training set using the exact same EM procedure.
We then assess the ability of the fitted DWT and PSWM models to explain the ChIP-seq data. Both the PSWM and DWT model assign an effective binding energy E(s) to each possible length-l sequence segment s which is given by the log-likelihood ratio of s under the PSWM or DWT model and the background model, i.e. E(s) = log[P (s|M)/P (s|B)]. Ideally, using either the DWT or PSWM model that assigns binding energies E(s) to all sequence segments genome-wide, we would rigorously calculate a likelihood P (D|E) of obtaining the entire ChIP-seq data-set D, i.e. the precise number of reads at every position of the genome, as a function of the binding energy model E. Unfortunately, in an in vivo situation the binding along the genome does not only depend on the nuclear concentration of the TF and local binding energies E(s) but also on many other parameters such as chromatin state, binding of co-factors, etcetera. We therefore approximate P (D|E) for the ChIP-seq epxeriment by imagining an idealized in vitro experiment in which purified TF is mixed with the test set of observed peak sequences and a large set of ‘decoy sequences’, and this mixture is subjected to chromatin immunoprecipitation.
In particular, besides the 500 peak sequences of the test set, we create 2000 random decay sequences that have the same overall dinucleotide frequencies and distribution of lengths as the binding peaks. Given the binding energies E(s), we can calculate the overall binding affinity to each of the 2500 longer sequence S (500 peaks and 2000 decoys) under both the PSWM and DWT models as
Note that this sum includes both segments on the positive and negative strand of the sequence S. Fig. 2d shows the distributions of the inferred binding energies of the peak and decoy sequences of the test set for DWT and PSWM motifs inferred for the TF CEBPB.
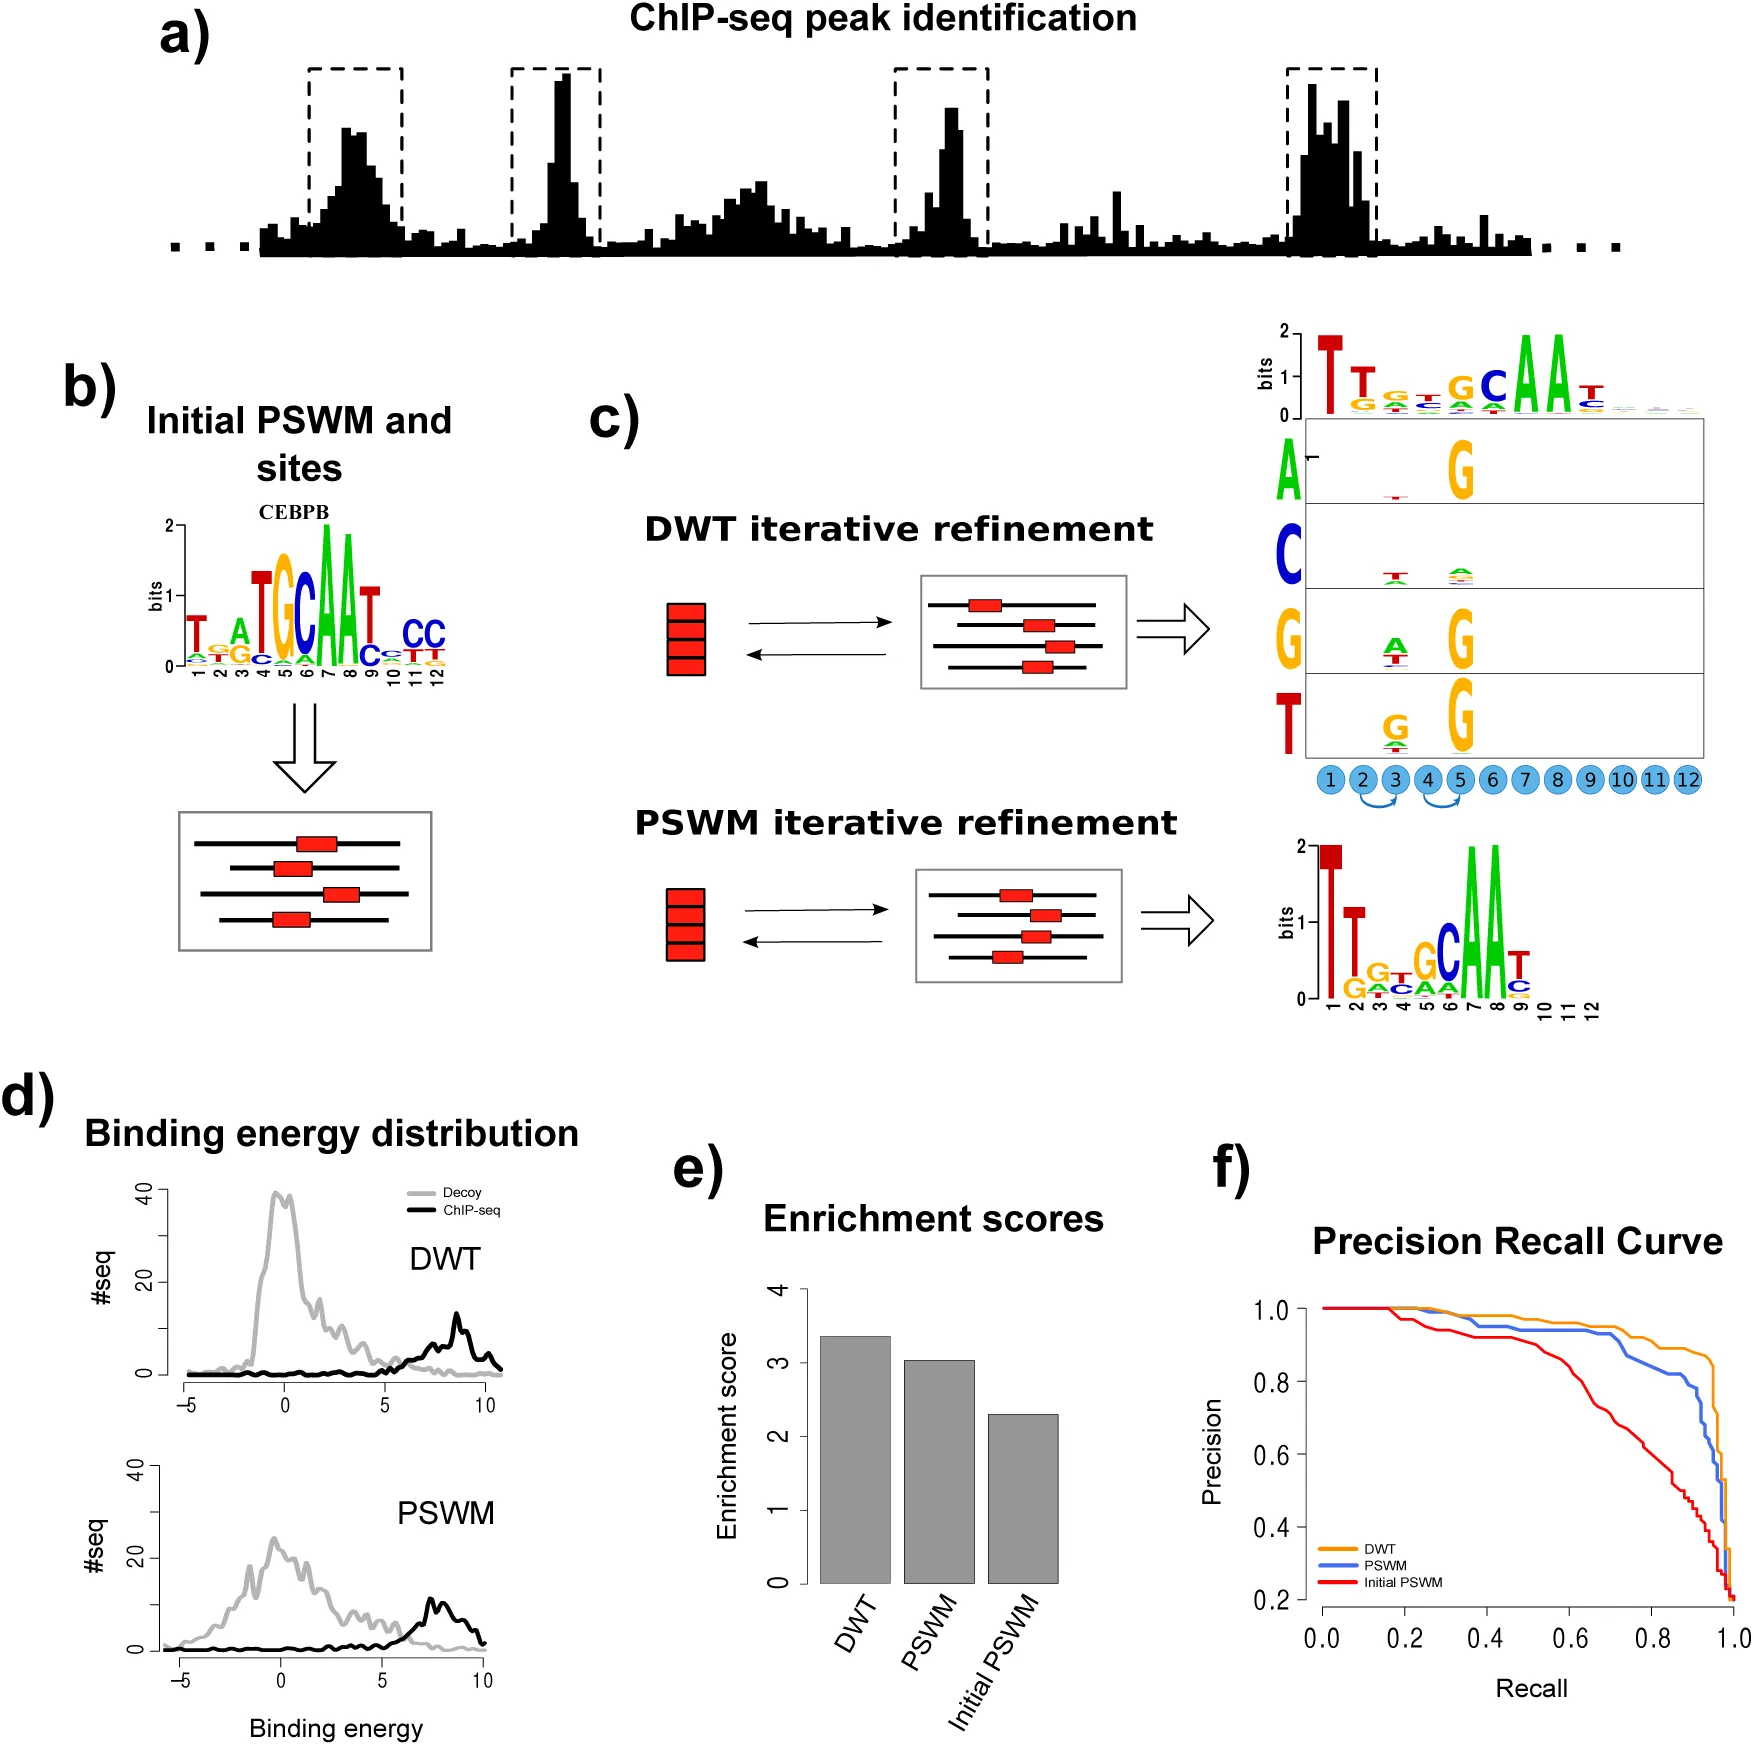
Figure 2:Comparison of DWT and PSWM performance on ChIP-seq data.
a) For a given ChIP-seq data-set we use the CRUNCH ChIP-seq analysis pipe-line to identify the top 1000 binding peaks and randomly subdivide these into an training set and a test set of 500 peak sequences each (see supplementary materials for details). b) Standard PSWM motif finding is used to determine an initial PSWM motif Siddharthan et al., 2005Arnold et al., 2012. c) Using expectation maximization, a PSWM and a DWT model are fitted on the training data. d) Distributions of the predicted binding energies, under both the DWT and PSWM models, of the 500 peak sequences and a set of 2000 random ‘decoy sequences’ that have the same lengths and dinucleotide composition as the peak sequences. e) Enrichment scores for the DWT model, the fitted PSWM model, and the initial PSWM model, quantifying the ability of the models to distinguish peak sequences from the decoys. f) Precision recall curves demonstrating the ability of the DWT, PSWM, and initial PSWM models to classify peak sequences and decoys based on the predicted binding energies of the sequences.
In our idealized ChIP-seq experiment, each sequence S is bound by the TF with a probability proportional to eE(S) and we calculate P (D|E) as the probability that, when immunoprecipitating TF-bound sequences, we end up sampling exactly all peak sequences, and none of the decoy sequences. That is, let T denote the entire test set of sequences, which separates into a ‘foreground’ set F of peak sequences and a ‘background’ set B of decoy sequences. The probability that, when immuno-precipitating a single sequence, the resulting sequence will be S, is given by


Fig. 2d-f show the results of our comparison on ChIP-seq data for the TF CEBPB. Fig. 2d shows the distributions of binding energies that are assigned to the true binding peaks (black) and the decoy sequences (grey) for the fitted PSWM motif, as well as the fitted DWT motif. Comparison of these distributions makes clear that the predicted binding energies of true binding peaks and decoys show a substantially larger separation in the DWT model. Interestingly, this increased separation results mainly from the binding energies of the decoy sequences being more tightly focused at low values. This behavior is observed for a large number of the TFs that we analyzed. Our log-enrichment performance measure clearly shows the DWT outperforming the PSWM models (Fig. 2e). This superior performance is not specific to our enrichment measure. For example, if we use the predicted binding energies E(S) to classify the test set sequences into binders and decoys, then standard precision-recall curves also show the DWT clearly outperforming the PSWMs (Fig. 2f).
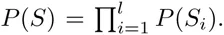
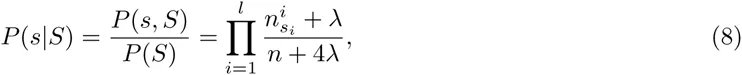
Figure 3 compares the performance, as measured by log-enrichment, of the DWT and PSWM models on all ENCODE ENCODE-Project-Consortium, 2012 ChIP-seq data-sets that we studied. Remarkably, with the exception of some minor score fluctuations, the DWT model performs at least as well as the PSWM model on all data-sets. This shows that, even though the DWT has no explicit regularization scheme or, in fact, any tunable parameters at all, the model never suffers from over-fitting. Moreover, the DWT model clearly outperforms PSWMs for a substantial fraction of the datasets. Note that, since the test-set has 500 peak sequences, a log-enrichment difference as small as 0.1 corresponds to a total log-likelihood difference of 50.
We investigated whether TFs for which the DWT most significantly outperforms the PSWM tend to fall within particular structural families and did not find an any clear association (data not shown).
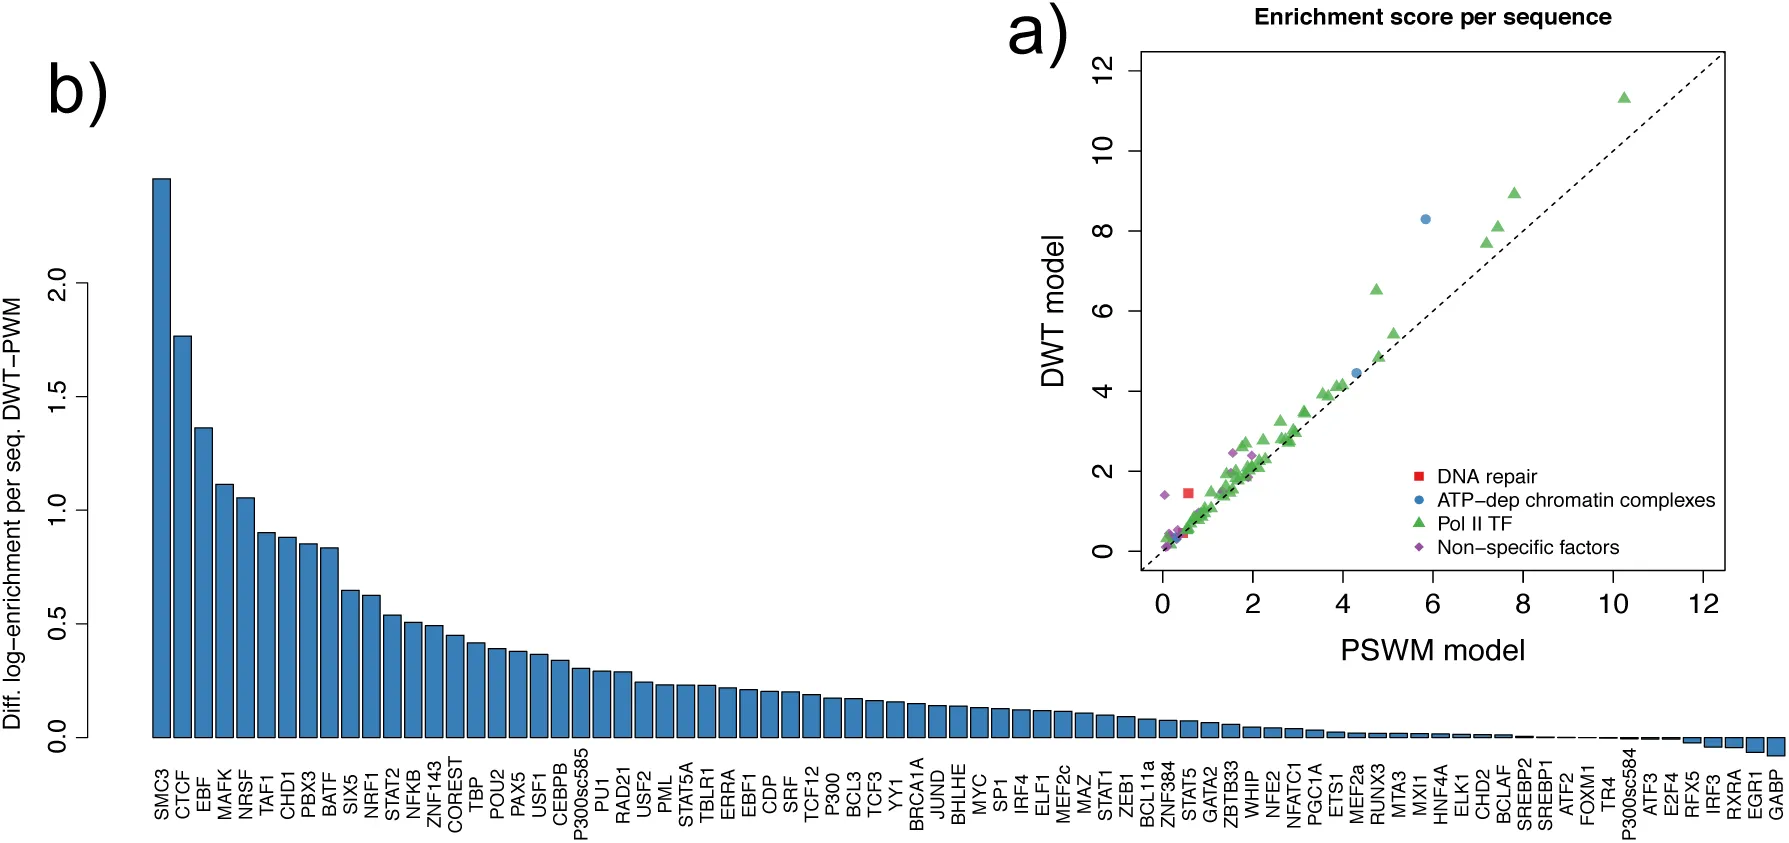
Figure 3:Comparison of the performance of DWT and PSWM Models on the ENCODE ChIP-seq data-sets.
a: Each dot corresponds to one ENCODE ChIP-seq data-set with the horizontal axis showing the performance of the PSWM model and the vertical axis the performance of the DWT model as measured by the log-enrichment per sequence ∈. The colors indicate different types of the TFs, with green corresponding to ‘standard’ sequence-specific PolII TFs, red corresponding to DNA binding factors involved in DNA repair, blue to ATP-dependent chromatin remodeling complexes, and purple to other types of non-specific DNA binding factors and co-factors. The dotted line shows the line y = x. As expected, the highest performance scores are observed for sequence-specific PolII TFs.b: The difference in log-enrichment between the DWT and PSWM model for each TF sorted from high to low.
Although it is true that DWTs without any clear pairwise dependencies generally do not outperform PSWMs, the reverse is not true. That is, there are data-sets for which DWTs show pairwise dependencies with very high posterior, but where the DWT does not significantly outperform the PSWM. For example, the TF GABP shows two pairs of positions with very strong dependency, but the GABP DWT does not outperform the corresponding PSWM (see the table with results at http://
2.6Pairwise dependencies are enriched at neighboring positions
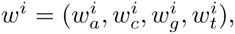
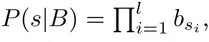
We investigated to what extent pairs of positions that show strong dependency are restricted to nearest-neighbor interactions. We first selected all pairwise dependencies with posterior at least 90% and calculated their distances along the binding site. Figure 4a shows the observed distribution of distances for these high confidence pairs. This distribution shows that nearest neighbor dependencies are much more frequent than dependencies at other distances.
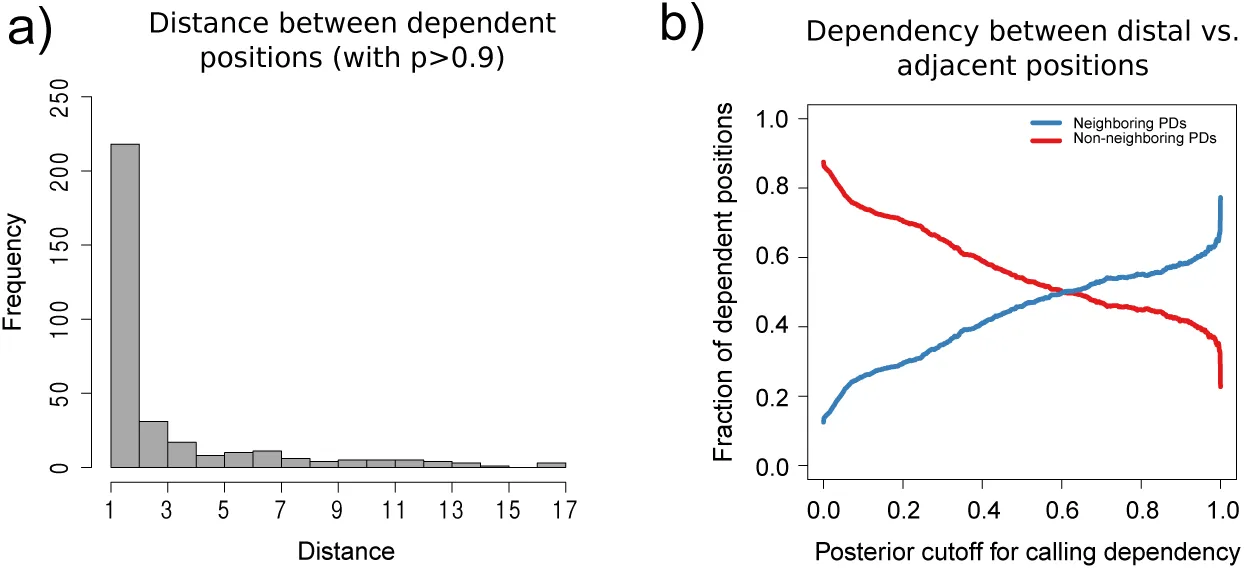
Figure 4:Frequency of nearest-neighbor and distal pair dependencies
a Histogram of distances along the primary sequence of all pair-dependencies with posterior at least 0.9. b Fraction of all dependencies that are nearest-neighbor (blue) versus distal (red) as a function of a cut-off on the posterior probability of the dependency.
However, a substantial number of dependencies between distal pairs are also observed. Figured 4b shows, as a function of a cut-off on the posterior probabilities of the dependencies, what fraction of predicted dependent pairs are nearest neighbors (blue) versus distal (red). This plot shows that, when only very high posterior dependencies are included, roughly two thirds of dependent pairs are nearest neighbors, whereas at lower cut-offs on the posterior probability of dependency, the majority of dependent positions are distal. These results confirm that, although nearest-neighbor interactions are the strongest, a large fraction of dependencies occur between more distal pairs, confirming that it is important to take distal dependencies into account.
2.7DWT models trained on ChIP-seq data outperform PSWMs on HT-SELEX data for the same TF
Systematic evolution of ligands by exponential enrichment (SELEX) is a well-established in vitro method for studying protein-DNA binding specificity Tuerk & Gold, 1990. Starting from a random pool of short DNA (or RNA) segments, the sequences are selected for binding to a DNA protein of interest. The sequences that bound the target are then amplified. This selection and amplification is repeated for multiple rounds to systematically enrich for sequences that strongly bind to the target protein. A high-throughput variant of this method (HT-SELEX), in which the sequences from each round are sequenced using next-generation sequencing was introduced by Jolma et al. Jolma et al., 2010, and has been more recently applied to a large number of human TFs Jolma et al., 2013. This HT-SELEX data provides a completely independent dataset for comparing the performance of DWT and PSWM models of TF binding affinities. Moreover, whereas ChIP-seq data arguably probes the in vivo binding of a TF in a specific cell type, the HT-SELEX experiment directly probes the binding properties of the DNA binding domain of the TF in an in vitro setting. It is thus interesting to investigate whether the DWT outcompetes PSWMs in this in vitro setting as well, and to what extent the binding specificities that were inferred from the ChIP-seq data also apply to the HT-SELEX data.
We selected a set of 17 TFs for which we have inferred DWT and PSWM models from the ChIP-seq data and for which HT-SELEX data is also available. We then calculated, for each of these TFs, how well these DWT and PSWM models (inferred from the ChIP-seq) explain the observed HT-SELEX data. To model that HT-SELEX data we assume that, at each round of the experiment, sequences are selected according to their binding energy to the TF, i.e. such that a sequence s has a probability proportional to eE(s) to be selected. Let ft(s) denote the frequency of sequence s in the pool of sequences at generation t of the HT-SELEX experiment, and let E(s) denote the total binding energy assigned by the model (either DWT or PSWM) to sequence s. Under this model, and in analogy to equation (14), the probability that a single selected sequence is sequence s is given by

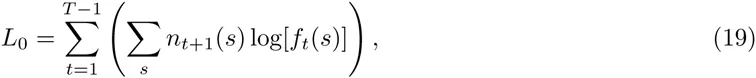
If we denote by nt(s) the number of occurrences of sequence s at generation t in the experiment, then the log-likelihood L(E) of the entire HT-SELEX data-set given an energy function E is given by


Equation (20) calculates the full likelihood of the entire HT-SELEX dataset for a given motif, and an optimal motif would thus maximize the enrichment (20). However, this approach is very different from the way by which sequence motifs have been inferred from HT-SELEX data so far Jolma et al., 2010Jolma et al., 2013. In these works, the most common k-mers are extracted from the data at one (late) round of the procedure, and a PSWM is inferred by comparing the frequency of the most common k-mer with the frequencies of point mutants of this consensus. At first glance it may seem that such an approach, which uses only a very small subset of the available data, must be inferior to approaches that include information from all the data. However, upon close inspection of the HT-SELEX data we have found that, even in late rounds of the HT-SELEX procedure, a very large fraction of the observed sequences does not appear to contain any binding sites for the motif in question, and we suspect that this is the reason that previous approaches have explicitly focused on a small subset of sequences that were most enriched. Indeed, when we calculate the log-enrichment (20) from full HT-SELEX data-sets, we find that the common occurrence of ‘background’ sequences without binding sites leads to negative enrichments for most TFs.
To avoid the influence of the large fraction of background sequences that persist through all rounds of the procedure, we filtered out all sequences with energies less than 5 according to either the PSWM or DWT model. That is, we calculate the observed enrichment across all rounds, of all sequences that have at least a reasonable match to both the PSWM and DWT motifs. Figure 5 shows the resulting log-enrichment per sequence for the HT-SELEX experiments for both the DWT and PSWM models, as well as the total log-likelihood differences between the DWT and PSWMs for the 17 TFs that we tested. For 16 of the 17 TFs, the DWT outperforms the PSWM model on the HT-SELEX data (Fig. 5, lower panel). In 4 cases there is a very large improvement, i.e. with log-enrichment per sequence ranging from 11.25 to 0.65. Note that a log-enrichment difference of 0.65 per sequence corresponds to each observation in the HT-SELEX data-set being exp(0.65) ≈ 2 times as likely under the DWT model as under the PSWM model. For the next 7 TFs the log-enrichment improvement per sequence ranges from 0.076 to 0.024. The latter corresponds to roughly 2.5% improvement in likelihood per observation. Although this is relatively modest, given the very large number of independent observations in the HT-SELEX data, this improvement is still highly statistically significant. The next 6 TFs show log-enrichment improvements per sequence that are quite small, ranging from 0.01 to 4 ∗ 10−5. Finally, for the TF SRF we find that the PSWM outperforms the DWT with an improvement of about 0.02 in log-enrichment per sequence.
In summary, for all but one of the TFs, the DWT model that was inferred from ChIP-seq data also outperforms the PSWM model on HT-SELEX data for the same TF.
3Discussion
Since its introduction in the early 1980s Stormo et al., 1982, the PSWM model has become the workhorse for binding site prediction in regulatory genomics. However, as data has accumulated, evidence has been mounting over the last decade that there can be significant dependencies between the nucleotides occurring at different positions of regulatory sites such as TFBSs. Consequently, there is a strong need for extending regulatory motif models to take such dependencies into account. However, in order for such an extension to gain wide acceptance the motif model should be rigorous, flexible, be guaranteed to perform at least as well as PSWMs in all situations, and be easy to use. Appraoches that have been presented so far have either made unrealistic restrictions on the models, e.g. by demanding that dependencies can only exist between neighboring positions, or they have involved complex ad hoc regularization schemes to avoid over-fitting, that make them umbersome to use in practice.
Here we have presented a new motif model, the dinucleotide weight tensor, that is general in that it allows for dependencies between arbitrary positions in the motif, it is rigorous in that it is derived from first principles, and avoids it over-fitting by explicitly marginalizing over all unknown parameters. In particular, because the model has no tunable parameters at all, it can be easily and robustly applied in practice. Indeed, by inferring DWTs on a large set of ChIP-seq datasets, we have shown that DWTs always perform as least as well as PSWMs and outcompete them in a substantial fraction of the cases. The fact that DWT models inferred from ChIP-seq data also outperform PSWMs on HT-SELEX data, suggests that the dependencies captured by the DWT reflect something in the biophysics of the interaction between the DNA binding domain of the TF and the DNA sequence of the site. In addition, our observation that, while significant dependencies can occur between distal positions, interactions between neighboring positions are highly enriched, is also consistent with this interpretation.
An interesting area for future research is to investigate the possible structural and biophysical basis for the observed direct dependencies. However, we should note that we already invested a considerable efforts ourselves in analyzing whether the occurrence of dependencies can be related to structural features of the TFs, or to the way that they interact with the DNA, but we have so far been unable to uncover any clear biophysical interpretation of the observed dependencies. It is conceivable that there is no simple biophysical interpretation to the direct dependencies. For example, inspection of some of the DWT models suggests that dependencies often cause combinations of deleterious mutations to reduce the binding energy less than predicted by the PSWM model and this might be a global effect that is spread across many dependencies, rather than reflecting particular structural features of the TF-DNA interaction.
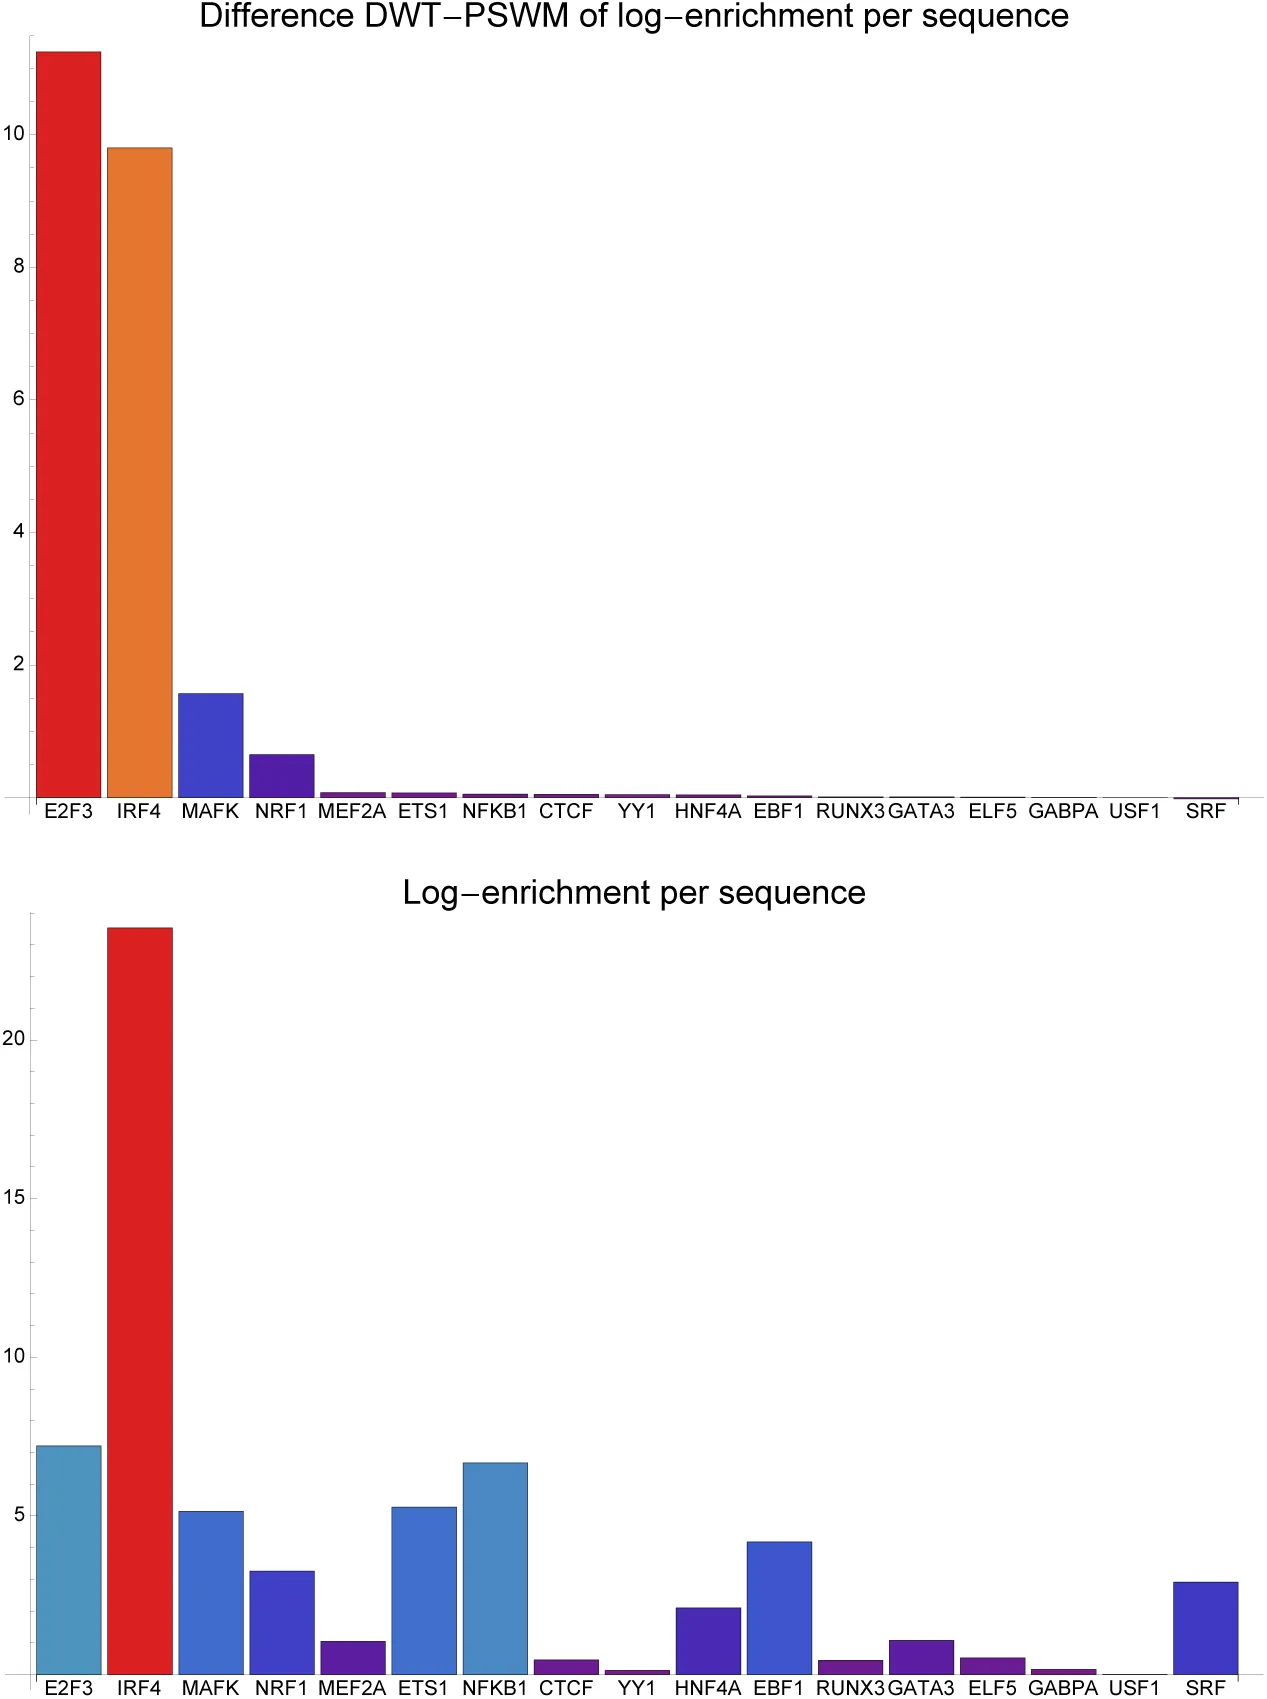
Figure 5:Comparison between the DWT and PSWM Models on the HT-SELEX data.
The bottom panel shows the log-enrichment per sequence for the DWT models that were inferred on ChIP-seq data, when applied to HT-SELEX data Jolma et al., 2013, for 17 TFs for which HT-SELEX data was also available. The top panel shows the differences in log-enrichment per sequence between the DWT and PSWM models. The TFs are sorted from left to right in order of decreasing difference in log-enrichment.
Our analysis has also shown that, nothwithstanding the fact thatDWTs strongly outperform PSMWs for some TFs, for the majority of TFs the improvement that the DWT provides is rather modest. This highlights that, for many TFs, PSWMs are sufficiently accurate for TFBS prediction, and few significant dependencies exist. Consequently, robust practical application of more complex motif models requires strong safe-guards against over-fitting, i.e. because for many TFs there will simply not be many strong dependencies. This is arguably the biggest advantage of the DWT models presented here: DWTs have no parameters to tune whatsoever, never overfit, and automatically reduce to a PSWM model when no significant dependencies exist. We believe that these properties make DWTs especially attractive for adopting in practical settings and we hope that many researchers can be convinvced to start using DWT models in their motif finding and TFBS prediction.
4Contributions
EvN designed the study, SO performed the study, and the paper was writte by both SO and EvN.
5Supplementary Material
5.1Calculating posterior probabilities for the pairwise dependencies
As part of the dilogo we calculate, for each pair of positions (i, j) the posterior probability P (i, j|S), that a direct dependency between exists between positions i and j, given the sequence alignment S. As we have shown previously Burger & Nimwegen, 2010, the posterior probability P (i, j|S) is given by of the sum of P (S|π) over all spanning trees in which the edge (i, j) occurs, divided by P (S), i.e. P (S|π) summed over all trees, irrespective of the occurrence of the edge (i, j). That is, we have

As we also derived previously Burger & Nimwegen, 2010, this posterior can be calculated by defining a new (l − 1) by (l − 1) matrix R(i,j) in which the two nodes i and j have been ‘contracted’ into a single node (i, j). The entries for the matrix elements involving this node are given by


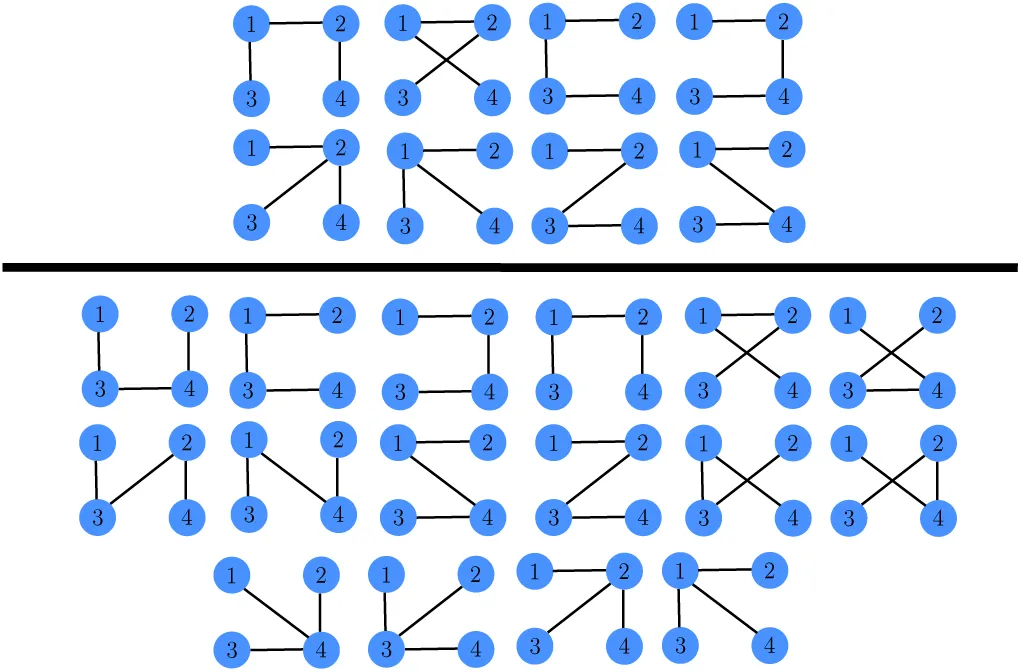
Figure 6:Illustration of the calculation of the posterior probability that positions 1 and 2 are directly connected, for the simple case of sequences of length 4. Each position is represented by a node in the possible spanning tree graphs π. In the numerator are all trees in which the edge (1, 2) appears, and in the denominator are all possible spanning trees.
5.2Rescaling of the dependency matrix
When the pair-counts


6Test and Results
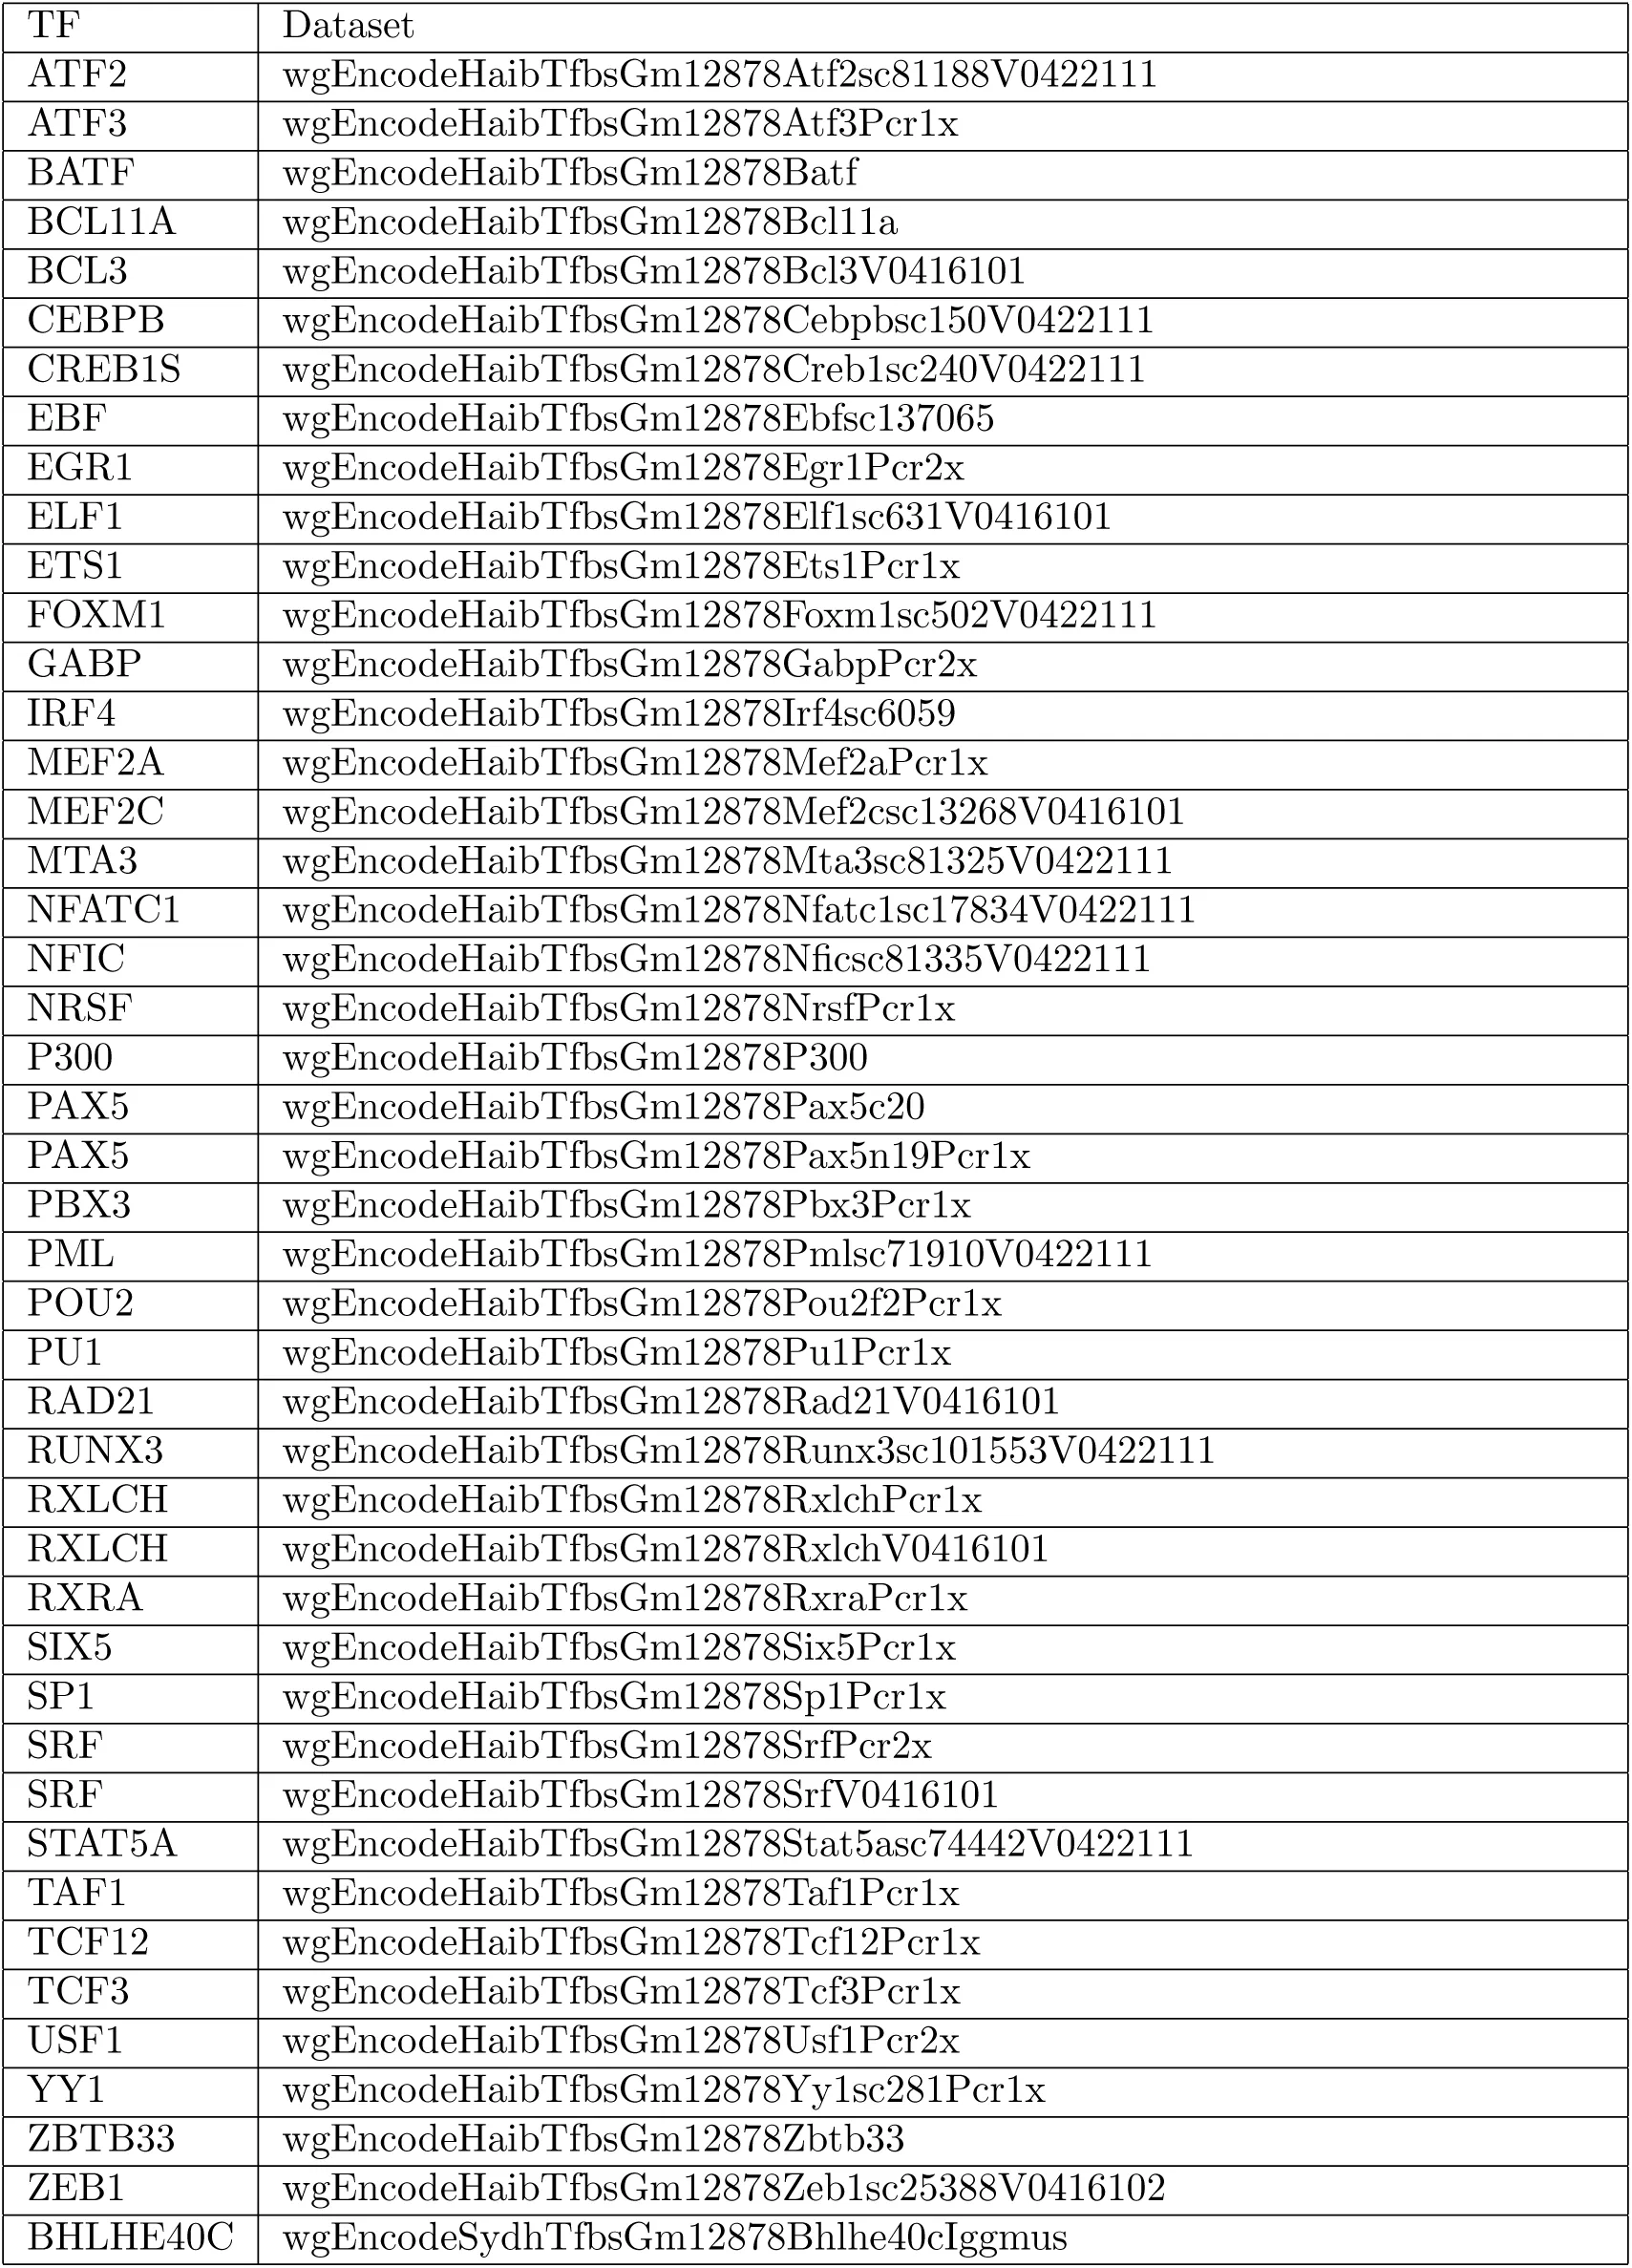
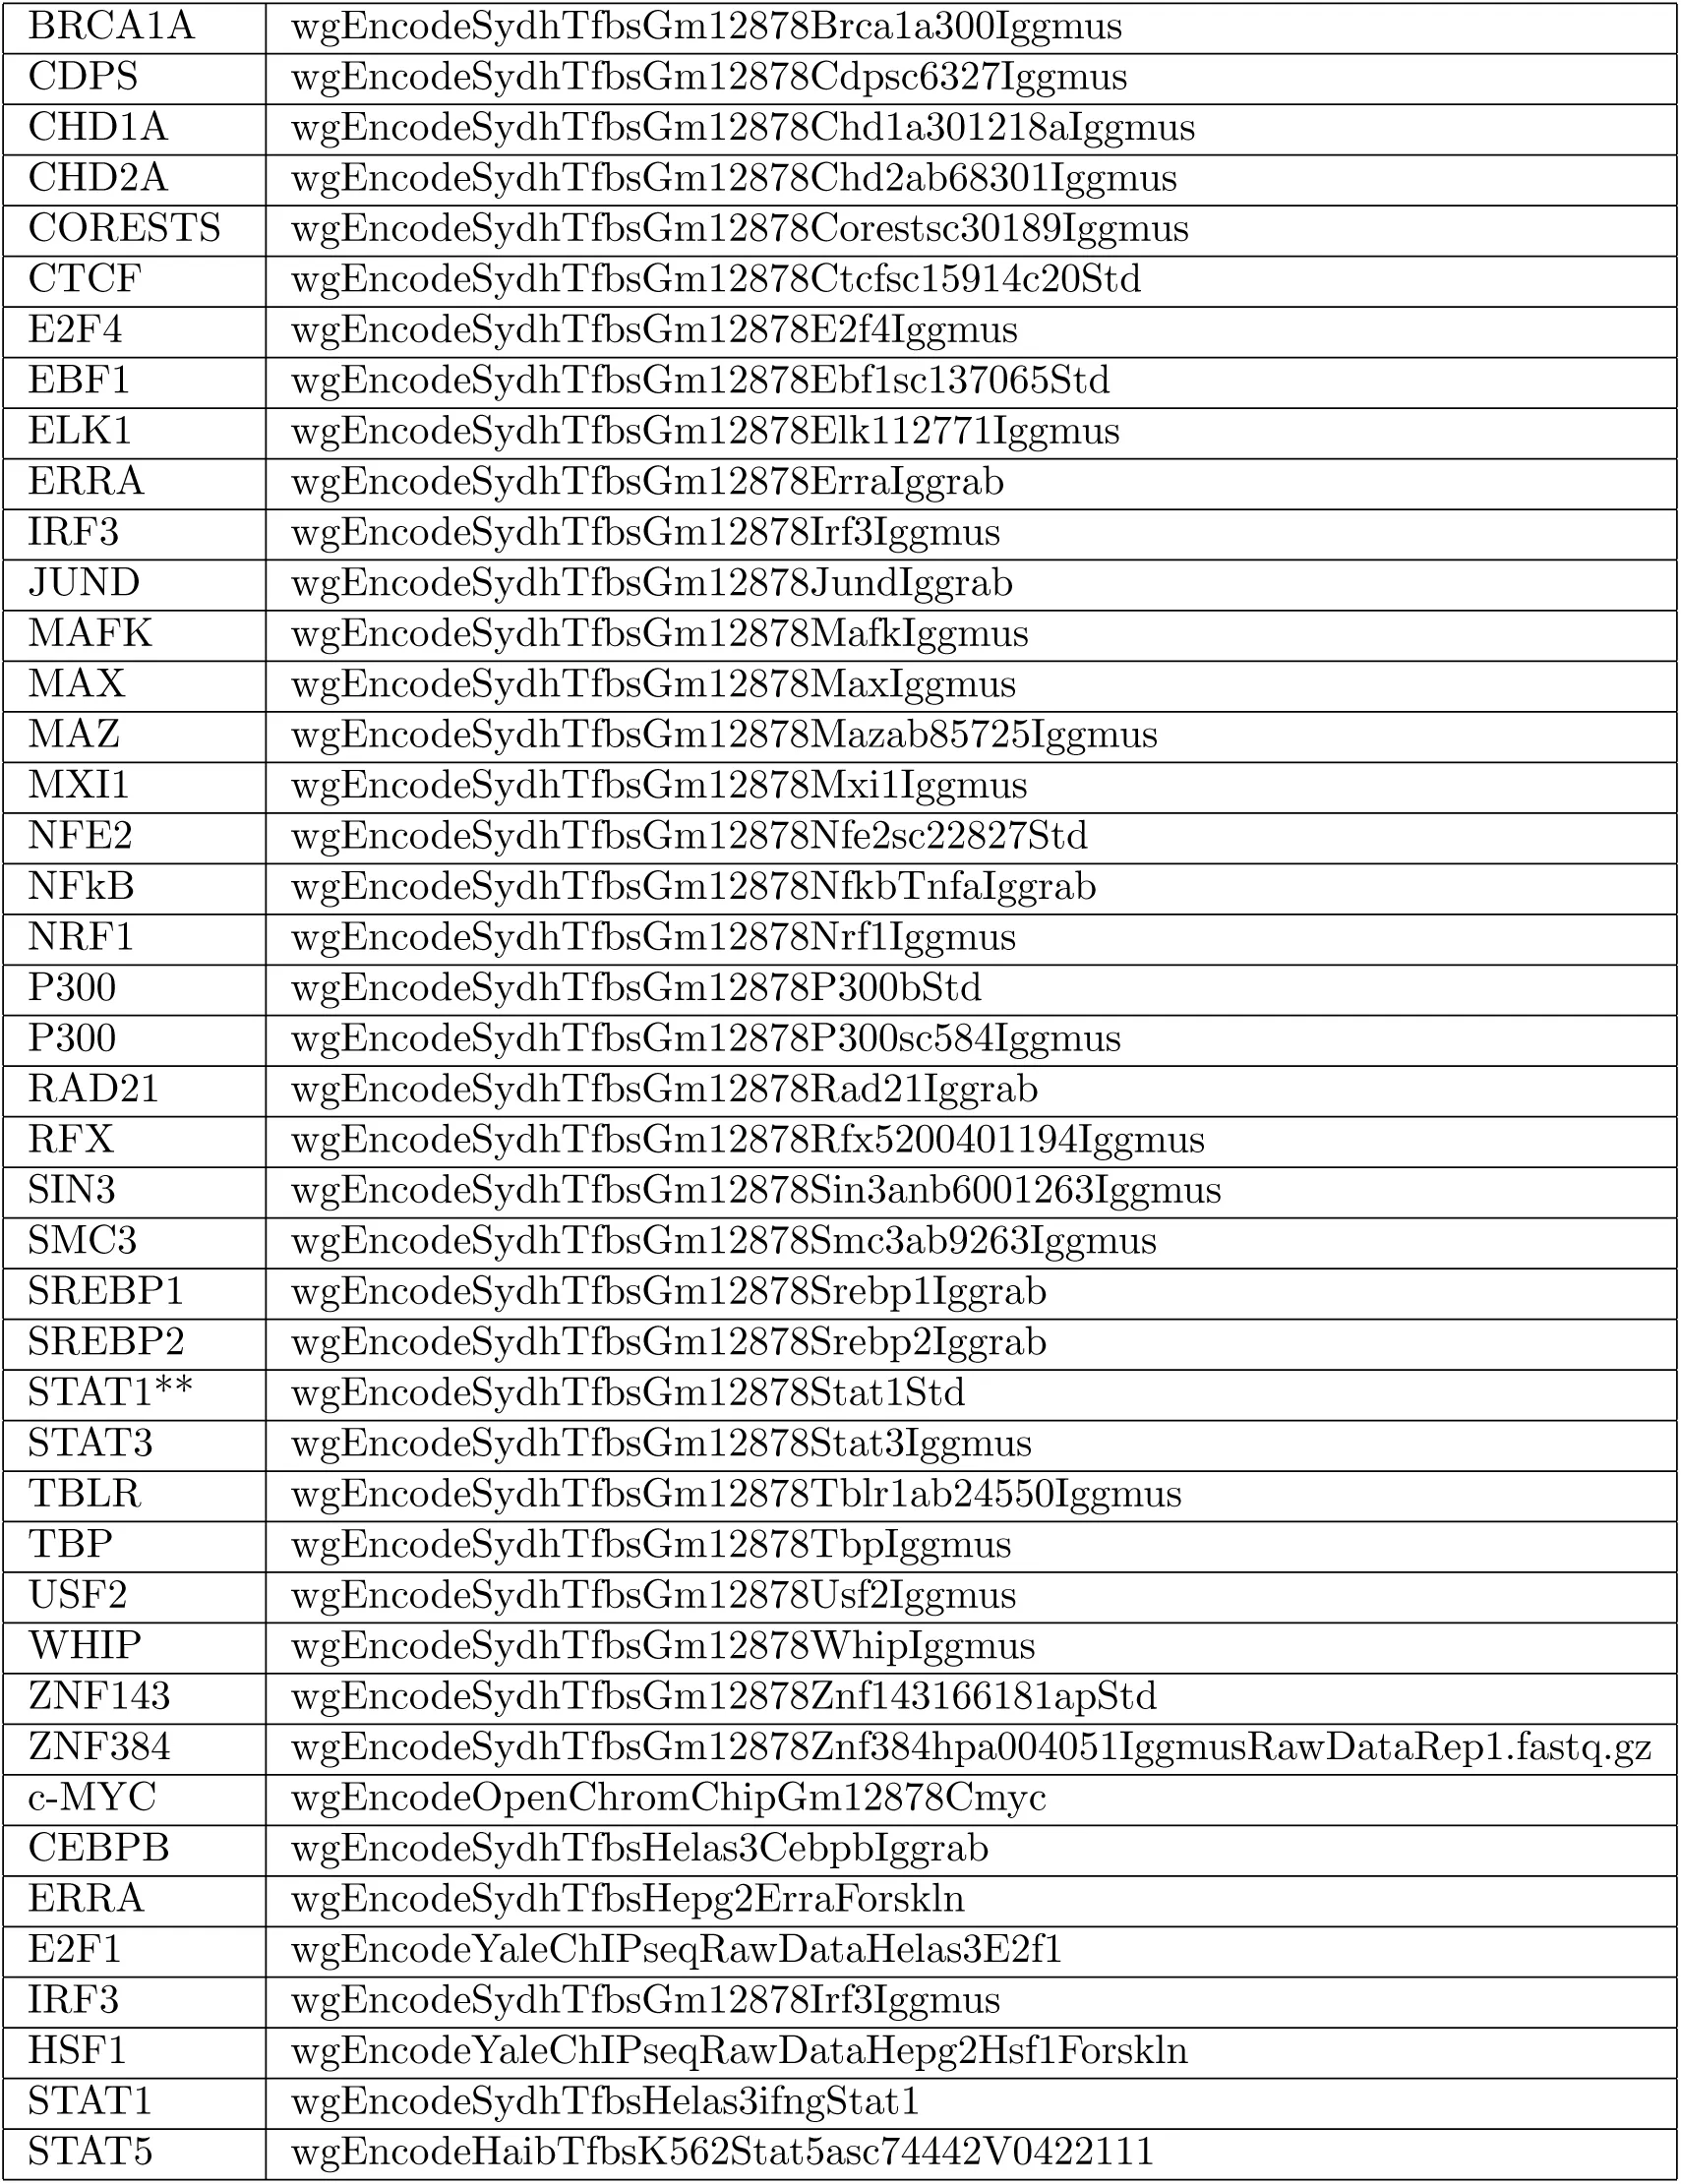
We have selected 78 TF ChIP-seq data published by ENCODE Consortium ENCODE-Project-Consortium, 2012. The list of the raw FASTQ data we have analyzed is given in table 1.
Table 1:The ENCODE TF ChIP-seq data that are analyzed for this project
SO thanks Lukas Burger for help with the Bayesian model and its implementation, Severin Berger for assistance with the analysis of the ChIP-seq data, Mikhail Pachkov with setup of the DWT website, and Peter Pemberton-Ross and Stephanie Bishop for help with the writing of the manuscript. This work was supported by the Swiss Institute of Bioinformatics (SIB) PhD program grant, and by SystemsX.ch through the CellPlasticity project grant.
Copyright © 2026 Omidi & Nimwegen. This article is distributed under the terms of the Creative Commons Attribution Non Commercial 4.0 International license, which enables reusers to distribute, remix, adapt, and build upon the material in any medium or format for noncommercial purposes only, and only so long as attribution is given to the creators.
- DWT
- dinucleotide weight tensor
- EM
- expectation maximization
- ML
- maximum likelihood
- PBM
- protein binding microarray
- PDs
- pairwise dependencies
- Paillard, G., & Lavery, R. (2004). Analyzing protein-DNA recognition mechanisms. Structure, 12, 113–122.
- Endres, R., Schulthess, T., & Wingreen, N. (2004). Toward an atomistic model for predicting transcription-factor binding sites. Proteins, 57, 262–268.
- Morozov, A., Havranek, J., Baker, D., & Siggia, E. (2005). Protein-DNA binding specificity predictions with structural models. Nucleic Acids Res, 33, 5781–5798.
- Berg, O., & von Hippel, P. (1987). Selection of DNA binding sites by regulatory proteins: Statistical-mechanical theory and application to operators and promoters. J Mol Biol, 193, 723–750.
- van Nimwegen, E. (2007). Finding regulatory elements and regulatory motifs: a general probabilistic framework. BMC Bioinformatics, 8(6), S4.
- Seeman, N., Rosenberg, J., & Rich, A. (1976). Sequence-specific recognition of double helical nucleic acids by proteins. Proc Natl Acad Sci USA, 73, 804–808.
- Johnson, D., Mortazavi, A., Myers, R., & Wold, B. (2007). Genome-wide mapping of in vivo protein-DNA interactions. Science, 316, 1497–1502.
- Mukherjee, S., Berger, M., Jona, G., Wang, X., Muzzey, D., & others. (2004). Rapid analysis of the DNA-binding specificities of transcription factors with DNA microarrays. Nat Genet, 36, 1331–1339.
- Ogawa, N., & Biggin, M. (2012). High-throughput SELEX determination of DNA sequences bound by transcription factors in vitro. Methods Mol Biol, 786, 51–63.
- Man, T., & Stormo, G. (2001). Non-independence of mnt repressor-operator interaction determined by a new quantitative multiple fluorescence relative affnity (qumfra) assay. Nucleic Acids Res, 29, 2471–2478.
- Bulyk, M., Johnson, P., & Church, G. (2002). Nucleotides of transcription factor binding sites exert interdependent effects on the binding affinities of transcription factors. Nucleic Acids Res, 30, 1255–1261.
- Badis, G., Berger, M., Philippakis, A., Talukder, S., Gehrke, A., & others. (2009). Diversity and complexity in dna recognition by transcription factors. Science, 324, 1720–1723.
- Nutiu, R., Friedman, R., Luo, S., Khrebtukova, I., Silva, D., & others. (2011). Direct measurement of dnaaffnity landscapes on a high-throughput sequencing instrument. Nat Biotechnol, 29, 659–664.
- Siddharthan, R. (2010). Dinucleotide weight matrices for predicting transcription factor binding sites: generalizing the position weight matrix. PLoS One, 5, e9722.
- Mathelier, A., & Wasserman, W. (2013). The next generation of transcription factor binding site prediction. PLoS Comput Biol, 9, e1003214.