Training listeners to detect auditory-visual temporal coherence enhances their ability to exploit visual information for auditory scene analysis
Abstract
Listeners engaged in an auditory selective attention task are better able to report brief deviants in a target auditory stream when a task-irrelevant visual stimulus is coherently modulated with the target stream, than when it is coherent with the distractor stream Maddox et al., 2015. Here, we demonstrate that learning to better discriminate auditory-visual temporal coherence, but not simple exposure to temporally coherent AV stimuli, enhances the ability of listeners to exploit visual information in this task. After 5 short training sessions listeners were able to benefit from auditory-visual temporal coherence both when the visual stimulus is temporally coherent with the target or with the distractor stream, relative to an independently modulated condition. These findings indicate that training to discriminate cross-modal temporal coherence fundamentally changes how listeners exploit visual information for auditory scene analysis.
1Introduction
While some auditory-visual (AV) correspondences, such as temporal and spatial relations Spence & Deroy, 2012, seem to be innate or established very early in life, others, such as those that rely on semantic relations, are learned through experience Navarra et al., 2010. In our previous study Maddox et al., 2015, human participants performed an auditory selective attention task in which they were required to report brief frequency or timbre deviants in a target auditory stream, while ignoring those occurring in a simultaneous distractor. Listeners were better able to perform this task when changes in the size of a task-irrelevant visual stimulus were temporally coherent with intensity changes in the target auditory stream. Since the visual stimulus conveyed no information about whether or when auditory deviants occurred, we concluded that the only way in which listeners could benefit from AV temporal coherence was if this helped them to better segregate the competing auditory streams. We have since proposed that enhancement in a stimulus dimension (here, pitch or timbre) orthogonal to a cross-modal binding feature (here, temporally coherent changes in auditory intensity and visual size) is strong evidence for cross-modal binding Bizley et al., 2016 and demonstrated that the integration of visual information into early auditory cortex provides a potential mechanism for these effects Atilgan et al., 2018.
In the present study, we hypothesized that 1) that training participants to better detect AV temporal coherence might facilitate an improved ability to use visual information in the selective attention task, and 2) that the ability of an observer to detect auditory-visual temporal coherence might determine their ability to utilize such information to assist with auditory scene analysis.
2Results
We recruited participants and randomly assigned them to one of three groups, each of which performed a pre-test and post-test which comprised of the timbre variant of the selective attention task in Maddox et al., 2015 and a measurement of their ability to detect AV temporal coherence. In between the pre- and post-test, one group trained on an AV temporal coherence task (AVTC group, n=12), one group were trained on an AM rate discrimination task with temporally coherent AV stimuli (AVAM group, n=12), and a third group simply performed the pre-test and post-test (control, n=12; Fig. 1A).
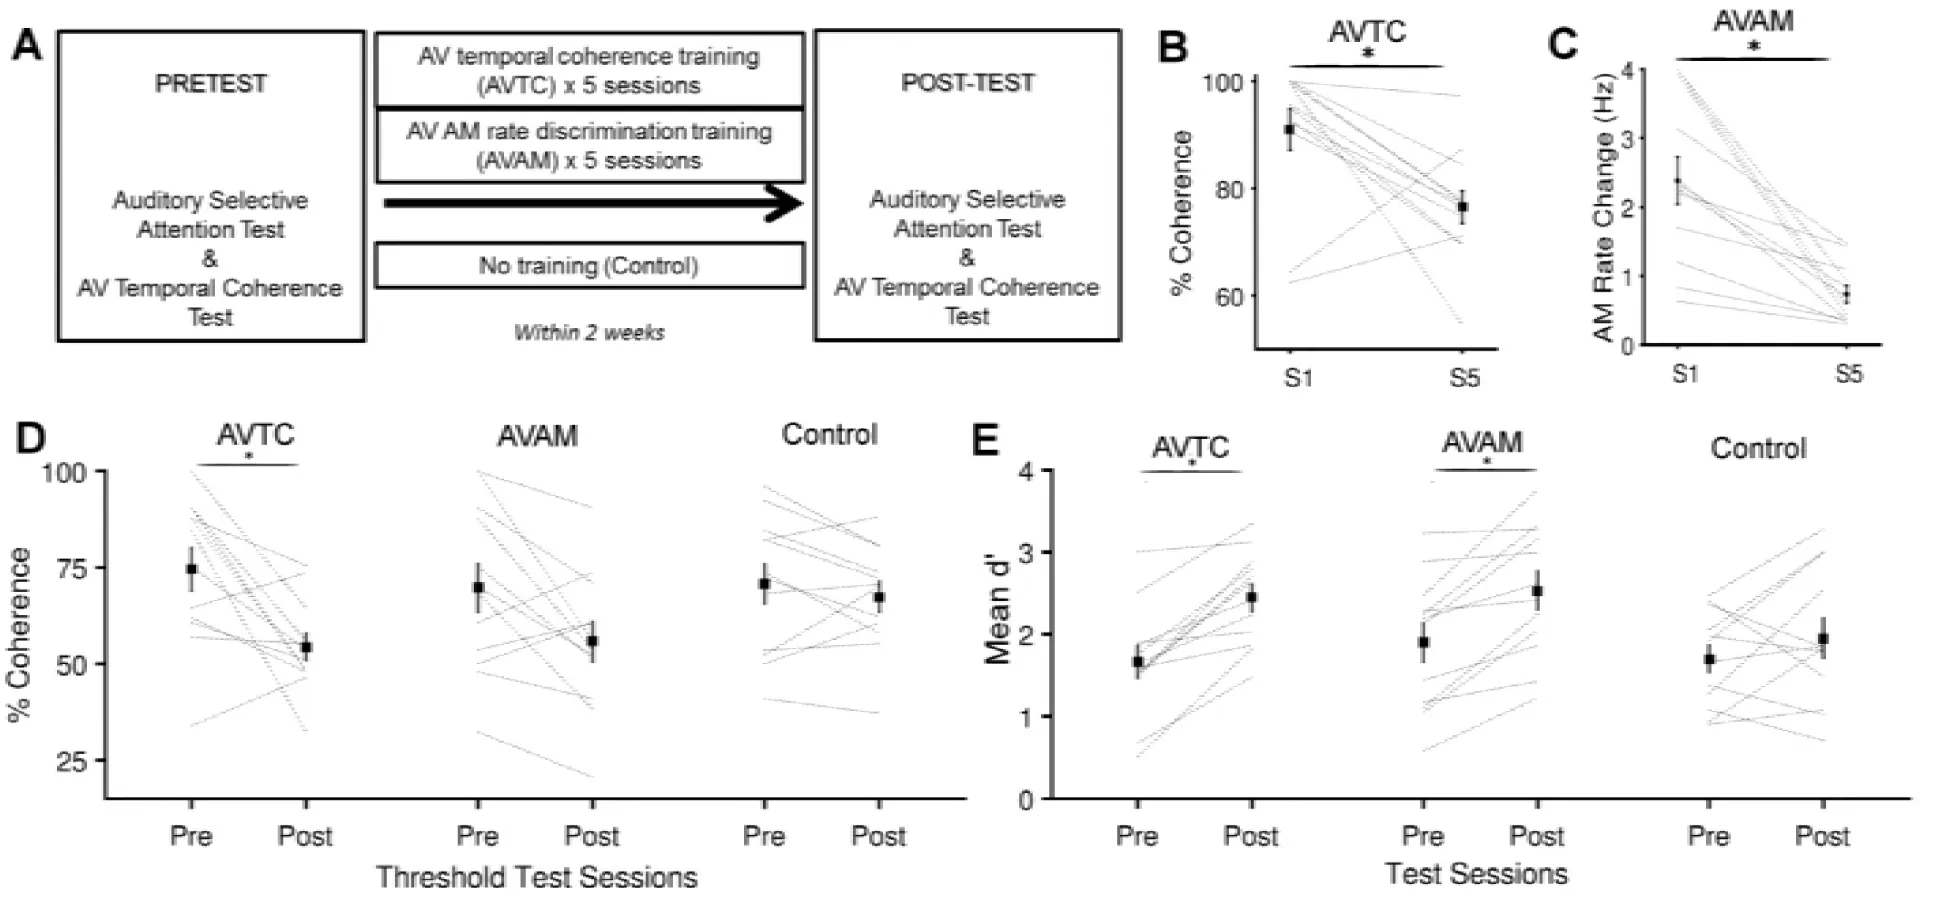
Figure 1:A Experimental design. B Training in AVTC task was effective at driving an improvement in AV temporal coherence discrimination between session (S1) and session 5(S5). Black line show the mean ± SEM across participants, gray lines are individual subjects. C Training in the AVAM task was effective at driving an improvement in AM rate discrimination between S1 and S5. D AV temporal coherence thresholds values of pretest and post-test for the three groups. E Mean d’ across AV coherence condition of pretest and post-test for the three groups. *indicates significant differences (Pairwise t-tests p < 0.05)
We first determined whether the five brief (< 40 minutes per session) training sessions experienced by participants in the training groups were sufficient to improve performance in the trained task. Both groups of participants showed improved performance between session 1 and 5 (Fig. 1B/C, pairwise t-test on S1 and S5 AVTC thresholds, t22 = 2.961, p=0.007; AVAM thresholds: t22 = 4.529, p<0.001).
Pairwise comparison between the AV temporal coherence thresholds measured in the pre- and post-test for the three experimental groups, revealed that coherence thresholds were significantly decreased only in the AVTC group (Fig. 1d, t22 = 3.081, p = 0.005) and not in the AVAM group (t22=1.69, p=0.104) or in the control group (t22 =0.234, p = 0.817). While the change in threshold for the AVTC group was correlated with the change in performance between session 1 and 5 (r = 0.632, p = 0.027), there was no correlation between the changes in AVAM threshold and AV temporal coherence threshold (r = 0.392, p = 0.207).
Having confirmed that training was effective, we turned to performance in the selective attention task. While neither training paradigm exposed participants to the deviants they were required to detect in the selective attention task, both groups were exposed to otherwise similar AV stimuli. We predicted that perceptual learning might drive improvements in performance in both trained groups but hypothesized that only the AVTC group would show a change in their ability to exploit visual stimuli. To detect overall changes in performance, we calculated the across condition sensitivity (d’), and directly compared the pre- and post-test data across the three experimental groups. A 2 x 3 way mixed ANOVA with factors of training (pre- and post-test) and experimental group (AVTC, AVAM and control) revealed a significant effect of training (F(1,71)=10.66, p=0.002) but the not experimental group (F(2,71) =1.75, p=0.181) and no interaction between experimental group and training (F (2, 71) = 0.86, p = 0.427). Pairwise comparisons between pre- and post-test data revealed that d’ values were significantly different only for the trained groups (Fig. 1D; AVTC group: t22 = 3.065, p=0.006, AVAM group: t22 = 1.920, p = 0.034; control group: t22 = 0.854, p = 0.402). Thus both experimental groups, but not the control group, improved their ability to detect timbre deviants in a target auditory stream.
To further understand the impact of training on the ability of participants to benefit from temporal coherence between auditory and visual streams, we next consider each group in turn. We calculated d’, bias, hit rates, false alarm rates and visual hit rates for each AV condition and conducted two-way repeated measures ANOVA on these values with factors of AV coherence (Target, Masker and Neither) and training (Pre- and Post-test; Table 1) for each experiment group. In the AVTC group, for d’, there was a significant effect of training (F (1, 71) = 9.39, p = 0.006), AV coherence (F (2, 71) = 9.13, p<0.001) and a significant interaction (Fig. 2A, D; F (2, 71) = 7.26, p = 0.002). Post-hoc comparison (p<0.05) across AV coherence condition in the pre-test revealed that participants performed better when the visual stimulus was coherent with the target auditory stream versus the masker auditory stream (Target > Masker; p = 0.0031, Bonferroni corrected α = 0.017). Similar results were obtained for hit rates (see Table 1). In contrast, post-hoc comparisons of the post-test d’ scores revealed that, after training, performance was better when the visual stimulus was coherent with either the target or the masker stream than the independent condition (Target> Neither, p = 0.0046; Masker> Neither, p = 0.0055, Bonferroni-corrected α = 0.017), indicating that participants were using visual information in a qualitatively different way after training. Like the participants in the AVTC group, participants in AVAM group were exposed to the target vowel sounds used in the ASA task but were not actively discriminating temporal coherence and were only exposed to temporally coherent stimuli. Training improved their performance in the ASA task (Fig. 2B, E). Both training (F(1,71)=5.31, p = 0.009) and AV coherence condition (F(2,71) = 3.69, p = 0.044) influenced d’, but – importantly – there was no interaction (F(2,71)=0.17, p=0.844). Post-hoc comparison (p<0.05) across AV coherence conditions in the pre- and post-test revealed that subjects performed better when the visual stimulus was coherent with the target auditory stream vs the masker auditory stream (Target> Masker, Pre-test: p = 0.0049; Post-test: p= 0.0063). Therefore, this suggests an overall improvement in performance after AVAM group, but no change in the way in which subjects were able to exploit visual cues.
Table 1:The results of two-way repeated measures ANOVA for each variables (p < 0.05 in bold) for d’, Hit rates, false alarm and visual hit rates for three experimental groups.
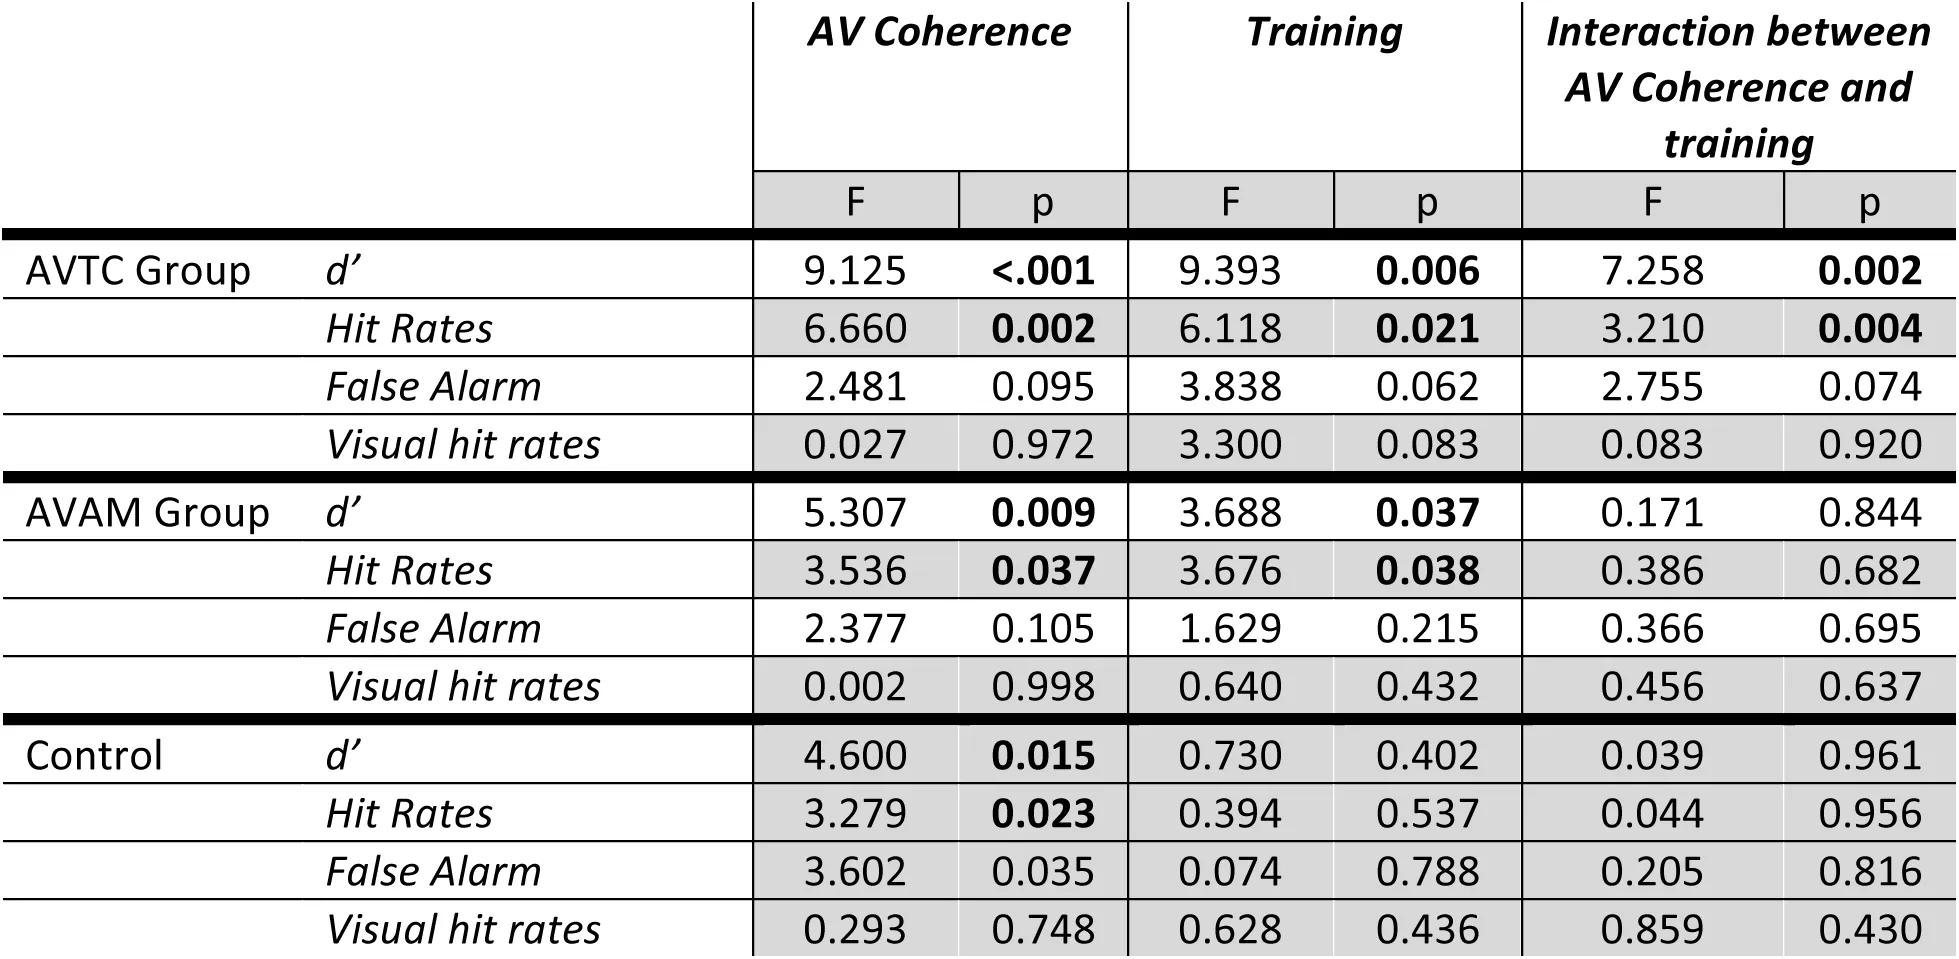
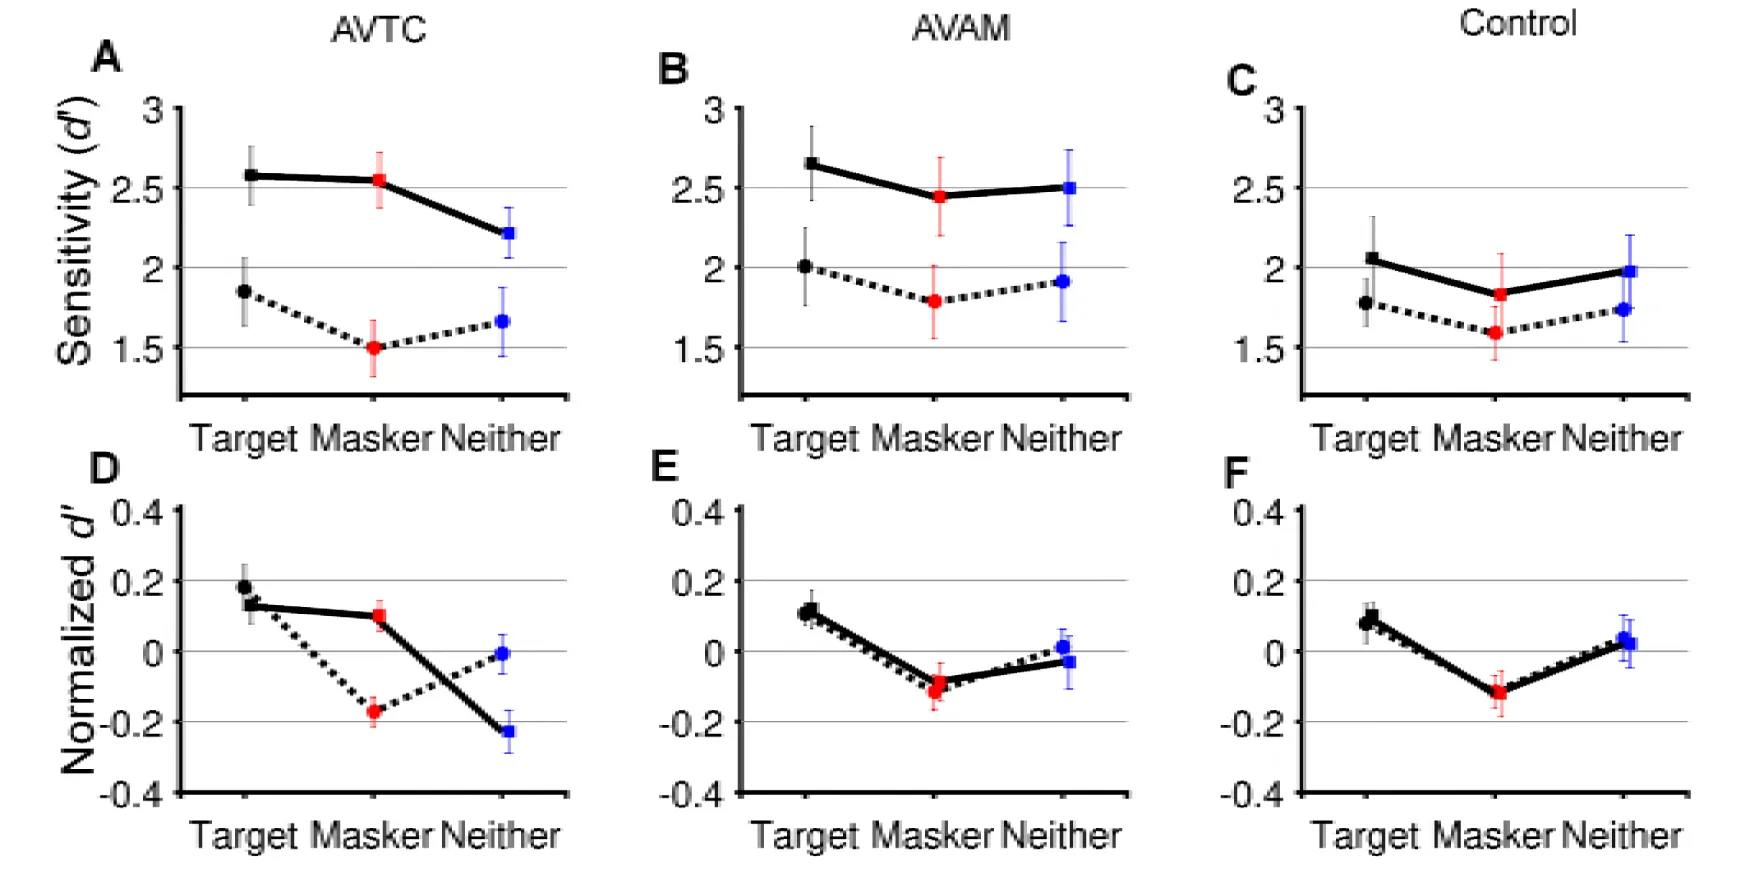
Figure 2:A-C pre-test (dashed line) and post-test (solid line) performance in the ASA task according to visual condition. A: AVTC group, B: AVAM group, C: control group. D-F Normalized mean ± SEM performance (calculated as within condition d’ normalized to across condition performance for pre- and post-test separately).
Performance in the control group did not differ between pre- and post-test (Fig 2C,G): there was no effect of test on d’ scores (F (1,71) = 0.730, p = 0.402), but a significant effect of AV coherence (F (2,71) = 4.600, p = 0.015), with no interaction (F(1,71) = 0.039, p = 0.961). Participants performed better when the visual stimulus was coherent with the target auditory stream versus the distractor auditory stream (Target > Masker, Pretest: p = 0.0032; Post-test: p= 0.013).
We explored individual differences in performance to test the hypothesis that the ability of naïve listeners to detect AV temporal coherence would predict their ability to benefit from AV temporal coherence in the ASA task: We correlated each listener’s AV temporal coherence threshold with the difference between the d’ score in the Target coherent and Masker coherent visual condition (Fig 3A). Contrary to our hypothesis, there was no relationship between these values (r = 0.1543, p = 0.3688), nor was there any relationship between overall performance (across condition d’) and AV temporal coherence thresholds (r = 0.2888, p = 0.0882). Having observed that the AVTC group improved their ability to utilize masker-visual stimulus temporal coherence, we considered whether temporal coherence thresholds might be correlated with the magnitude of the impairment that the masker-coherent condition had over the independent condition. The Masker-coherent – Neither comparison was weakly negatively correlated with AV temporal coherence thresholds (Fig.3B; r = 0.339, p = 0.0438) suggesting a trend where participants with better AV temporal coherence thresholds were more able to exploit the temporal coherence between masker and visual stimulus to yield a performance benefit relative to the independent condition. This finding mirrors the effect of training whereby improving AV coherence thresholds led to an improvement in the masker-coherent condition.
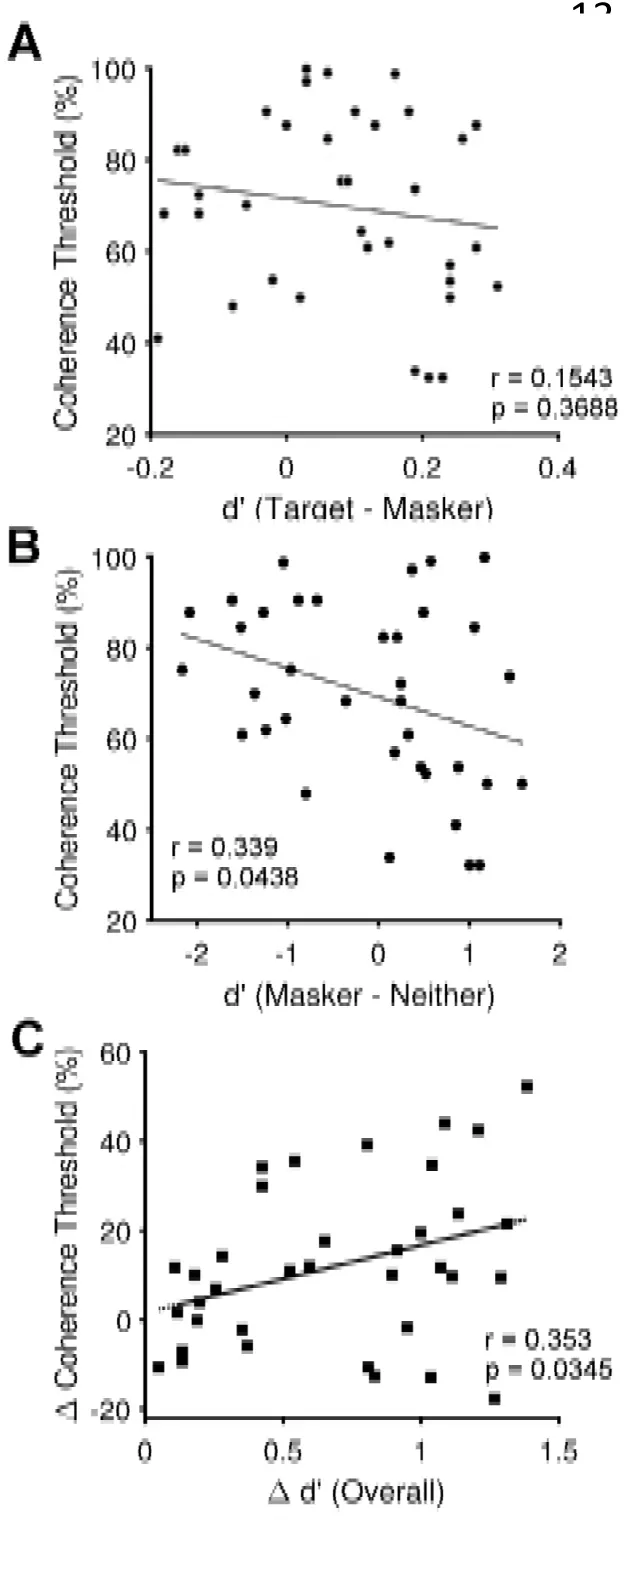
Figure 3:A Scatter plot showing the Target-Masker d’ difference for the 36 naïve listeners that completed the pre-test (positive values indicate superior target performance) versus AV coherence threshold (low values indicate better thresholds) for the pre-test data. There was no statistical relationship. B Scatter plot showing the Masker-Neither d’ difference for the 36 naïve listeners that completed the pre-test (negative values indicate masker performance is impaired relative to the independent condition) versus AV coherence threshold for the pre-test data. Participants who showed a benefit for the masker-coherent condition had lower AV coherence thresholds. C scatter plot showing a positive correlation between the change in overall performance between the pre-test and post-test (positive values indicate improvement) versus post- and pre-test change in AV coherence threshold (positive values indicate improvement).
Finally, participants’ change in performance between pre- and post-test was correlated with their change in ability to detect temporal coherence between auditory and visual stimuli. Participants with a larger change in their AV coherence threshold showed larger improvements in overall performance (Fig. 3C; r =0.353, p=0.0347).
3Discussion
Here we demonstrate that five short training sessions can improve both a listener’s ability to detect AV temporal correspondence and their ability to exploit cross-modal temporal coherence to segregate a sound mixture. This effect is principally driven by an improvement in the ability of listeners to exploit temporal coherence in the masker-coherent condition. We have demonstrated that the enhancement of one sound in a mixture by a temporally coherent visual stimulus is a stimulus driven, attention independent, bottom-up effect supported by the early integration of auditory and visual information in auditory cortex Atilgan et al., 2018. In keeping with our behavioral data from naïve listeners, such an enhancement seems likely to facilitate selective attention when the temporally coherent stream is a target, and impair it when that sound is a distractor. Nonetheless, if AV temporal coherence allows the representation of each of two competing sounds to be more distinct within sensory cortex then temporal coherence between target or masker should offer an advantage over an independently modulated visual stimulus. That this advantage is weakly present in some naïve listeners (Fig.3B) but appears strongly after training (Fig.1D) implies that it potentially arises from an interaction between the stimulus driven effects we observe in the absence of attention and a top-down process. Substantiating such speculation requires further behavioral and neurophysiological investigation. Previous studies have illustrated that visual cues can assist speech processing in noise Grant et al., 1998Schwartz et al., 2004Helfer & Freyman, 2005. While speech reading abilities are strongly predictive of audiovisual benefit for speech reception thresholds MacLeod & Summerfield, 1987, lip reading can influence auditory streaming Devergie et al., 2011, supporting they idea that lip reading benefits in noise potentially comprise of both bottom-up sensory effects that facilitate auditory scene analysis Atilgan et al., 2018 in addition to conveying phonetic information. An important question in interpreting the significance of our findings is whether the benefits in the auditory selective attention task transfer to other more real-world tasks such as utilizing speech reading in noisy listening conditions.
4Materials and methods
4.1Subjects
42 adults (age range 18–34 years; mean age 28 years; 11 males) with normal hearing and normal or corrected-to-normal vision, participated in the study. Six participants were excluded after the pretest due to poor performance (mean d’<0.8, n=4), or low visual hit rates (<70%, n=2). The remaining 36 participants were randomly allocated to three groups. Participants were paid for their participation and gave written informed consent to the study approved by the Ethics Committee of the University College London (ref: 5139).
4.2Stimuli and testing procedure
For the auditory selective attention task, the stimuli were generated and presented as described in the timbre variant of the previous study Maddox et al., 2015. That is, on each trial they heard two diotically presented artificial vowels with distinct pitches and timbres whose amplitudes were independently modulated with a low pass (<7 Hz) envelope. Unlike Maddox et al., we did not assess individual timbre discrimination thresholds but instead used a fixed level of difficulty determined using the individual thresholds measured in Maddox et al. For [i] deviants in [a] stimuli this corresponded to a shift of 42 Hz in F1 frequency and 143 Hz for F2, and for [e] deviants in [u] stream there was a shift of 75 Hz for F1, 196 Hz for F2. Both vowels could take either F0 value (175 Hz or 190 Hz, counterbalanced) and were equally likely to be target or masker. For AVTC and AVAM training and temporal coherence testing we used the same auditory (either [u] or [e], F0 = 175 or 190 Hz, counterbalanced) and visual (a radius-modulated gray disc) stimuli. Each pre- and post-test session lasted 90 minutes in total and was separated by a maximum of 2 weeks. Participants in the control group did no training sessions but performed the pre- and post-test within 2 weeks (mean ± SD = 5 ± 3 days).
For the AV coherence threshold test, two artificial vowel sounds (duration 5 seconds, with identical pitch and timbre within a trial, randomly drawn across trials, amplitude modulated < 7 Hz) were consecutively presented, each accompanied by a visual stimulus. In one interval, the radius modulation of the visual stimulus was independent of the envelope of the sound, while in the other interval, the auditory and visual stimulus maintained some degree of temporal coherence. The method of constant limits was used to determine the threshold with subjects performing 20 trials at each coherence level. AV stimuli were generated from 100% coherent in 10% steps to 10% coherent by multiplying the temporally coherent envelope with an independent envelope. Participants were required to select the interval (by pressing 1 or 2 on a button box) in which the temporally coherent pair was presented. Feedback was provided on every trial.
The stimuli and procedure in the AV coherence training were identical to those used in the threshold test, but with an adaptive three-down one-up rule to determine the coherence level of the stimulus in the next trial, as the goal was require that participants work near to threshold during the training session. In the first training session, the stimuli in the first trial were 100% coherent, and 100% independent. For the first 6 reversals coherency was decreased in 10% steps followed by 5% steps for the following six reversals and by 2.5% steps for the remainder. The procedure was terminated at 18 reversals unless a maximum of 150 trials was reached first. For the 2nd-5th training session the first “coherent” stimulus was generated with the average coherence level of the last ten reversals in the previous session. Each training session lasted less than 40 minutes. Feedback was provided on every trial.
Stimuli for AM rate discrimination task: Two temporally coherent AV stimuli (duration 5 s) were sequentially presented. In one interval the envelope was always generated with a 7 Hz cut off rate, whereas the other was generated with a higher rate (maximum AM cut off rate = 11 Hz). In the sessions of AM rate training, an adaptive three-down one-up rule was used to determine the AM rate of the stimulus in the next trial. In the first session, the first stimulus was generated at the maximum AM rate and differed in AM rate by 1Hz for the first six reversals and 0.5 Hz for the next six reversals and 0.25Hz for the rest of the trials. The procedure was terminated at 18 reversals unless a maximum of 150 trials was reached first. In each consequent session the first stimulus was generated with the average coherence level of the last ten reversals in the previous session. Participants pressed “1” or “2” on the press box to indicate the interval of the faster AV pair. Feedback was provided on each trial.
5Statistical Analysis
We used a two-way repeated measures analysis of variance (ANOVA) to test for differences in the d’, hit rates, false alarm, and visual hit rates across AV coherence and pretest versus post-test. Statistical tests were performed using the SPSS statistical software (version 20.0, IBM Corp., Armonk, NY, USA) and Matlab (2011b, MathWorks, USA)
This work was funded by a Wellcome Trust – Royal Society Sir Henry Dale Fellowship to JKB (ref: 098418/Z/12/Z) and an Action on Hearing Loss PhD studentship to HA. We are grateful to Suganya Mariyanesan for assistance in collecting the control data for this project, and to Ross Maddox and KC Lee for discussions of this work and critical evaluation of the manuscript.
Copyright © 2026 Atilgan & Bizley. This article is distributed under the terms of the Creative Commons Attribution 4.0 International license, which enables reusers to distribute, remix, adapt, and build upon the material in any medium or format, so long as attribution is given to the creators.
- ANOVA
- analysis of variance
- AV
- auditory-visual
- S1
- session
- Maddox, R., Atilgan, H., Bizley, J., & Lee, A. (2015). Auditory selective attention is enhanced by a task-irrelevant temporally coherent visual stimulus in human listeners. eLife, 4, e04995.
- Spence, C., & Deroy, O. (2012). Crossmodal correspondences: Innate or learned? I-Perception, 3, 316–318.
- Navarra, J., Alsius, A., Velasco, I., Soto-Faraco, S., & Spence, C. (2010). Perception of audiovisual speech synchrony for native and non-native language. Brain Res, 1323, 84–93.
- Bizley, J., Maddox, R., & Lee, A. (2016). Defining Auditory-Visual Objects: Behavioral Tests and Physiological Mechanisms. Trends Neurosci, 39, 74–85.
- Atilgan, H., Town, S., Wood, K., Jones, G., Maddox, R., Lee, A., & Bizley, J. (2018). Integration of Visual Information in Auditory Cortex Promotes Auditory Scene Analysis through Multisensory Binding. Neuron, 97, 640–655.
- Grant, K., Walden, B., & Seitz, P. (1998). Auditory-visual speech recognition by hearing-impaired subjects: consonant recognition, sentence recognition, and auditory-visual integration. J Acoust Soc Am, 103, 2677–2690.
- Schwartz, J., Berthommier, F., & Savariaux, C. (2004). Seeing to hear better: evidence for early audio-visual interactions in speech identification. Cognition, 93, B69-78.
- Helfer, K., & Freyman, R. (2005). The role of visual speech cues in reducing energetic and informational masking. J Acoust Soc Am, 117, 842–849.
- MacLeod, A., & Summerfield, Q. (1987). Quantifying the contribution of vision to speech perception in noise. British Journal of Audiology, 21, 131–141.
- Devergie, A., Grimault, N., Gaudrain, E., Healy, E., & Berthommier, F. (2011). The effect of lip-reading on primary stream segregation. J Acoust Soc Am, 130, 283–291.