Evolutionary, structural and functional explorations of non-coding RNA and protein genetic robustness
Abstract
The reactions of functional molecules like RNAs and proteins to mutation affect both host cell viability and biomolecular evolution. These molecules are considered robust if function is maintained alongside the mutation. RNAs and proteins have different structural and functional characteristics that affect their robustness, and to date, comparisons between them have been theoretical. In this work, we tested the relative mutational robustness of RNA and protein pairs using three approaches: evolutionary, structural, and functional. We compared the nucleotide diversities of functional RNAs with those of matched proteins. Across different levels of conservation, there were no differences in nucleotide-level variations between the biomolecules. We then directly tested the robustness of the RNA and protein pairs with in vitro and in silico mutagenesis of their respective genes. The in silico experiments showed that RNAs and proteins reacted similarly to point mutations and insertions or deletions. In vitro, mutated fluorescent RNAs retained greater levels of function than the proteins, but this may be because of differences in the robustness of the specific individual molecules rather than being indicative of a larger trend. In this first experimental comparison of proteins and RNAs, we found no consistent quantitative differences in mutational robustness. Future work on potential qualitative differences and other forms of robustness will give further insight into the evolution and functionality of biomolecules.
Significance Statement
The ability of functional RNAs and proteins to maintain function despite mutations in their respective genes is known as mutational robustness. Robustness impacts how molecules maintain and change phenotypes, which has a bearing on the evolution and the origin of life as well as influences modern biotechnology. Both RNA and protein have mechanisms that allow them to absorb DNA-level changes. Proteins have a redundant genetic code and non-coding RNAs can maintain structure through flexible base-pairing possibilities. The few theoretical treatments comparing RNA and protein robustness differ in their conclusions. In this experimental comparison of RNAs and proteins, we find that RNAs and proteins achieve remarkably similar degrees of overall genetic robustness.
1Introduction
Long known for its role in translation, RNA is commonly involved in controlling gene expression (e.g., bacterial small RNAs and microRNAs) Wassarman, 2002Bartel & Chen, 2004, intrinsic immunity (e.g., CRISPR-mediated acquired immunity) Jore & others, 2011Fischer & others, 2012Marraffini, 2015 and the cell’s response to environmental stimuli (e.g., thermosensors and riboswitches) Smith et al., 2010Breaker, 2010. The discovery of functional RNAs, like transfer RNA and catalytic RNAs, led to the proposal of an ancestral RNA world with RNA catalyzing the reactions of life and encoding genetic information Gilbert, 1986. Despite the importance of non-coding RNAs (ncRNAs) to cell function, many RNAs exhibit low sequence conservation and are not as broadly distributed as their proteinaceous brethren Hoeppner et al., 2012Lindgreen & others, 2014.
The ability to preserve a phenotype in the face of sequence perturbations is termed mutational robustness Visser & others, 2003Nimwegen et al., 1999Fontana & others, 1993Kimura, 1984. More robust molecules maintain their phenotypes despite mutations, while less robust molecules lose their function rapidly with mutation. The structural level at which mutation is considered, and the types of phenotypes that are measured, can vary between analyses. Here, we are considering mutations in DNA nucleotide sequence and how they modify phenotypes like the structure and function of encoded genes. RNAs and proteins have independent mechanisms that allow for near-neutral change within molecules, where structure and function are relatively unaffected by mutation (Table 1). RNA structure may be dominated by canonical Watson-Crick style base-pairings; however, a broad range of non-canonical interactions are possible between most base-pair combinations on each of the accessible pairing edges Leontis et al., 2002. Among these, the G:U wobble base-pair is frequently observed Haig & Hurst, 1991. The RNA secondary structure, and often function, can thus be preserved after mutation through a combination of canonical and non-canonical base-pair interactions Varani & McClain, 2000Alkatib & others, 2012Wagner, 2013.
Table 1:Avenues of neutral change within RNAs and proteins Ohta, 1973
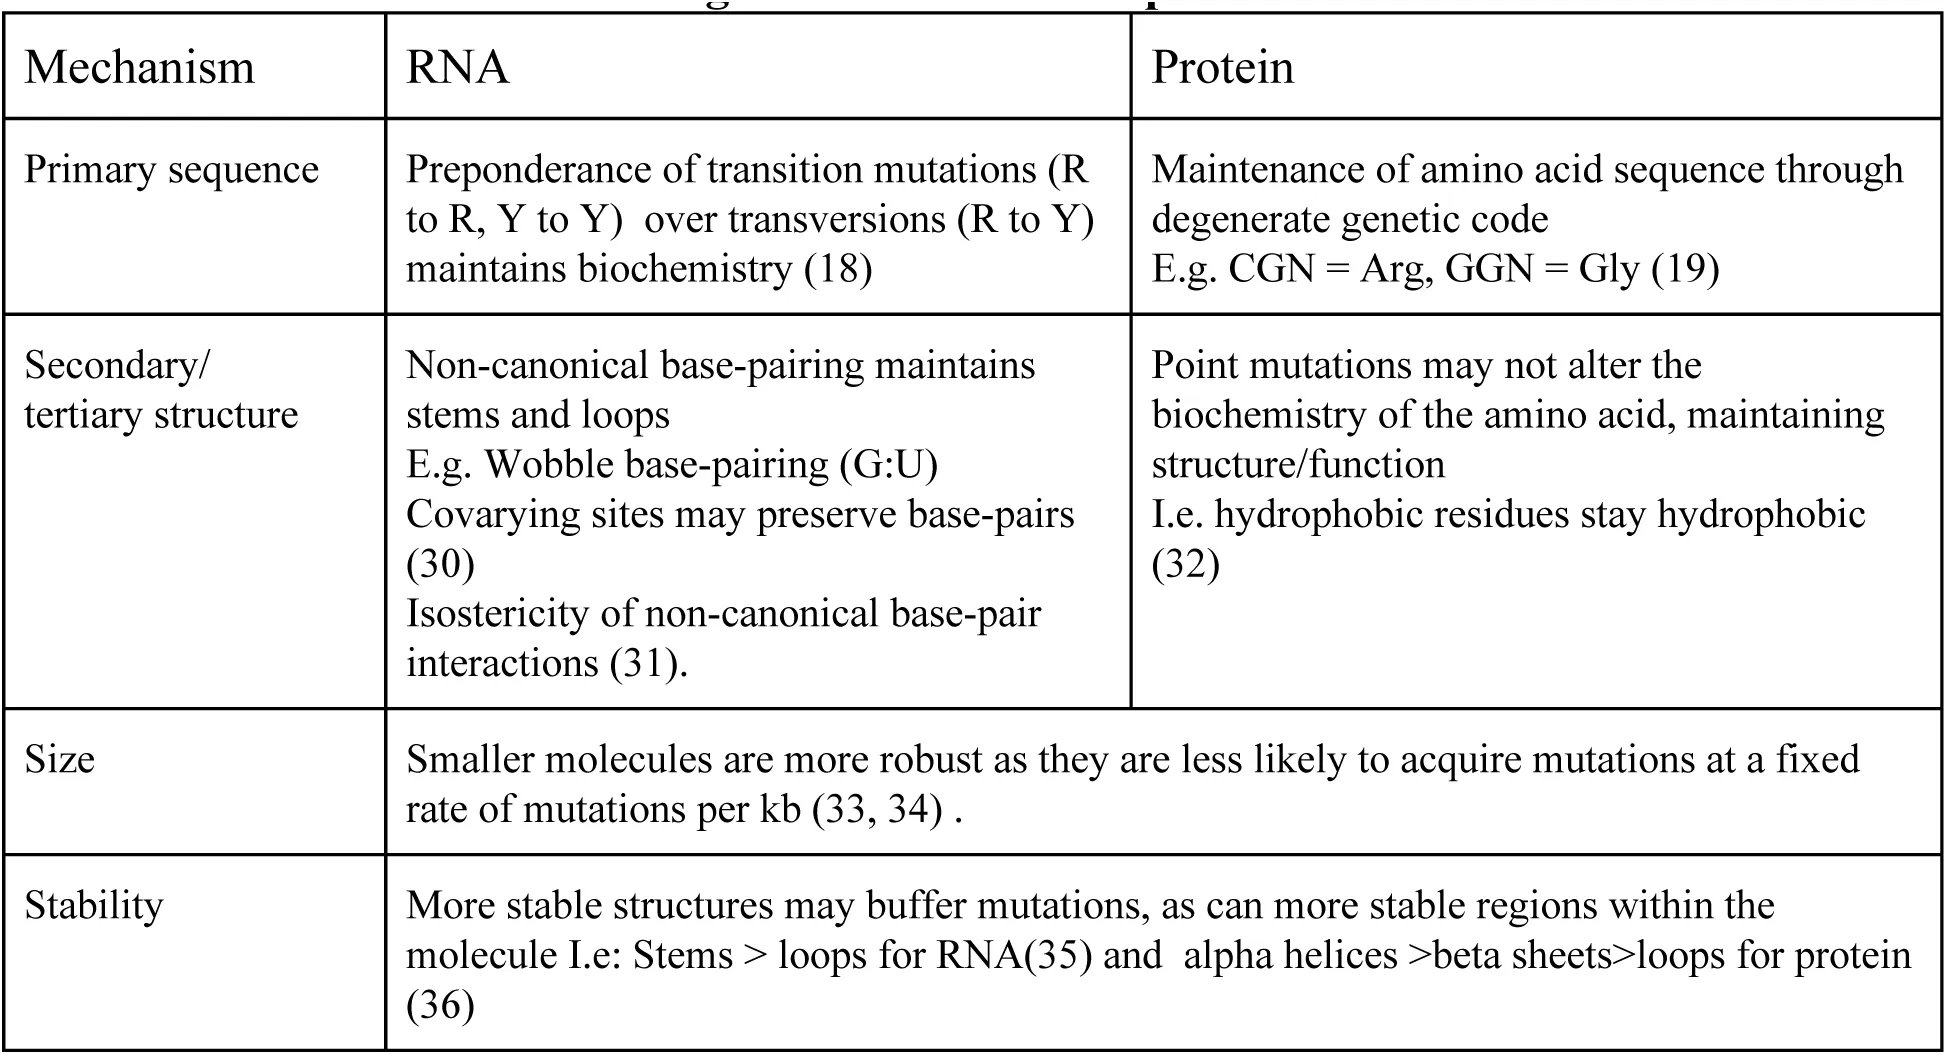
Protein robustness relies, in part, on the robustness of the genetic code. Degeneracy of the genetic code allows for mapping of up to six codons to the same amino acid Goldberg & Wittes, 1966. Furthermore, when point mutations change the amino acid, the new amino acid coded for is likely to have similar biochemical properties due to the code’s organization Dayhoff et al., 1978. Simulations have shown that the extant genetic code is significantly more robust to substitution and frameshift mutations than randomly generated genetic codes (Wagner, 2013Alff-Steinberger, 1969– Geyer & Madany Mamlouk, 2018). Premature stop codons and frameshift errors can be introduced by substitutions or indels (insertions and deletions). While ncRNA production requires transcription—and maybe some additional maturation such as editing, splicing or cleavage—proteins require further stages of maturation such as splicing and translation, which depend upon the maintenance of a correct reading frame Maquat, 1996. These additional steps likely amplify the potential harm of nucleotide changes Wang & Cooper, 2007. This is supported by the fact that disease-associated sequence variation is enriched ten-fold in human protein-coding regions Hindorff & others, 2009MacArthur & others, 2014 and that overall variation is reduced in coding regions, particularly indels Chen & others, 2009. Because of this, we hypothesize that RNAs are more robust to mutation than proteins, and can tolerate greater sequence change while maintaining function.
Previous experimental work has focused primarily on the robustness of either RNAs or proteins Sanjuan, 2006. To date, the only direct comparisons of RNA and protein robustness have involved theoretical treatment of neutral networks with simulated datasets Ferrada & Wagner, 2012Greenbury et al., 2016. Neutral networks are all sequences (RNA or protein) that give rise to the same phenotype, and are connected by a point mutation. A mutation that keeps the sequence within the network does not affect the phenotype. Early work has suggested that RNA networks and protein networks differ both in size and shape, which affects their robustness Ferrada & Wagner, 2012Greenbury et al., 2016Babajide et al., 1997Ahnert, 2017, while more recent work suggests the two biomolecules are actually similar Greenbury et al., 2016.
To begin exploring this issue, we asked whether RNAs and proteins differ overall in mutational robustness. Specifically, we investigated how mutations in DNA affect the structure and function of RNA and protein molecules using a combination of computational and experimental approaches. Given the variety of mechanisms and levels at which molecules can alter robustness (summarized in Table 1) and the biochemical differences between RNAs and proteins, it is impossible to make fair comparisons between them. No particular molecule, with its own selection history and functional constraints, is absolutely representative of its type. Nonetheless, in exploring differences between protein and RNA robustness under comparable conditions, we may gain insight into the evolution of RNAs and proteins.
2Results
We devised three independent in silico and in vitro tests to explore whether RNAs and proteins differed in their robustness to mutation. First, we considered the degree of sequence change between matched RNA and protein families. These pairs have shared functions (e.g., ribosomal RNA and protein components, or riboswitches and the proteins these generally regulate) and shared phylogenetic distributions and selection histories. Our expectation is that more robust genes will tolerate more mutations over fixed timescales and thus exhibit greater sequence change than less robust genes, allowing us to differentiate between them. Second, we mutated a functionally linked RNA and protein pair and predicted structures for these with in silico methods to compare their structural robustness. This is a more direct measure of robustness to mutation, but it only measures the probabilities of predicted structures and does not necessarily capture when function itself is lost. These results may be influenced more by the robustness of the computational methods than genuine mutational robustness. Finally, we compared function directly with mutagenesis of functionally comparable fluorescent RNA You & Jaffrey, 2015Filonov et al., 2014 and protein Shimomura et al., 1962Prendergast & Mann, 1978Tsien, 1998, and quantified the fraction of mutants that maintained function for each class of molecule.
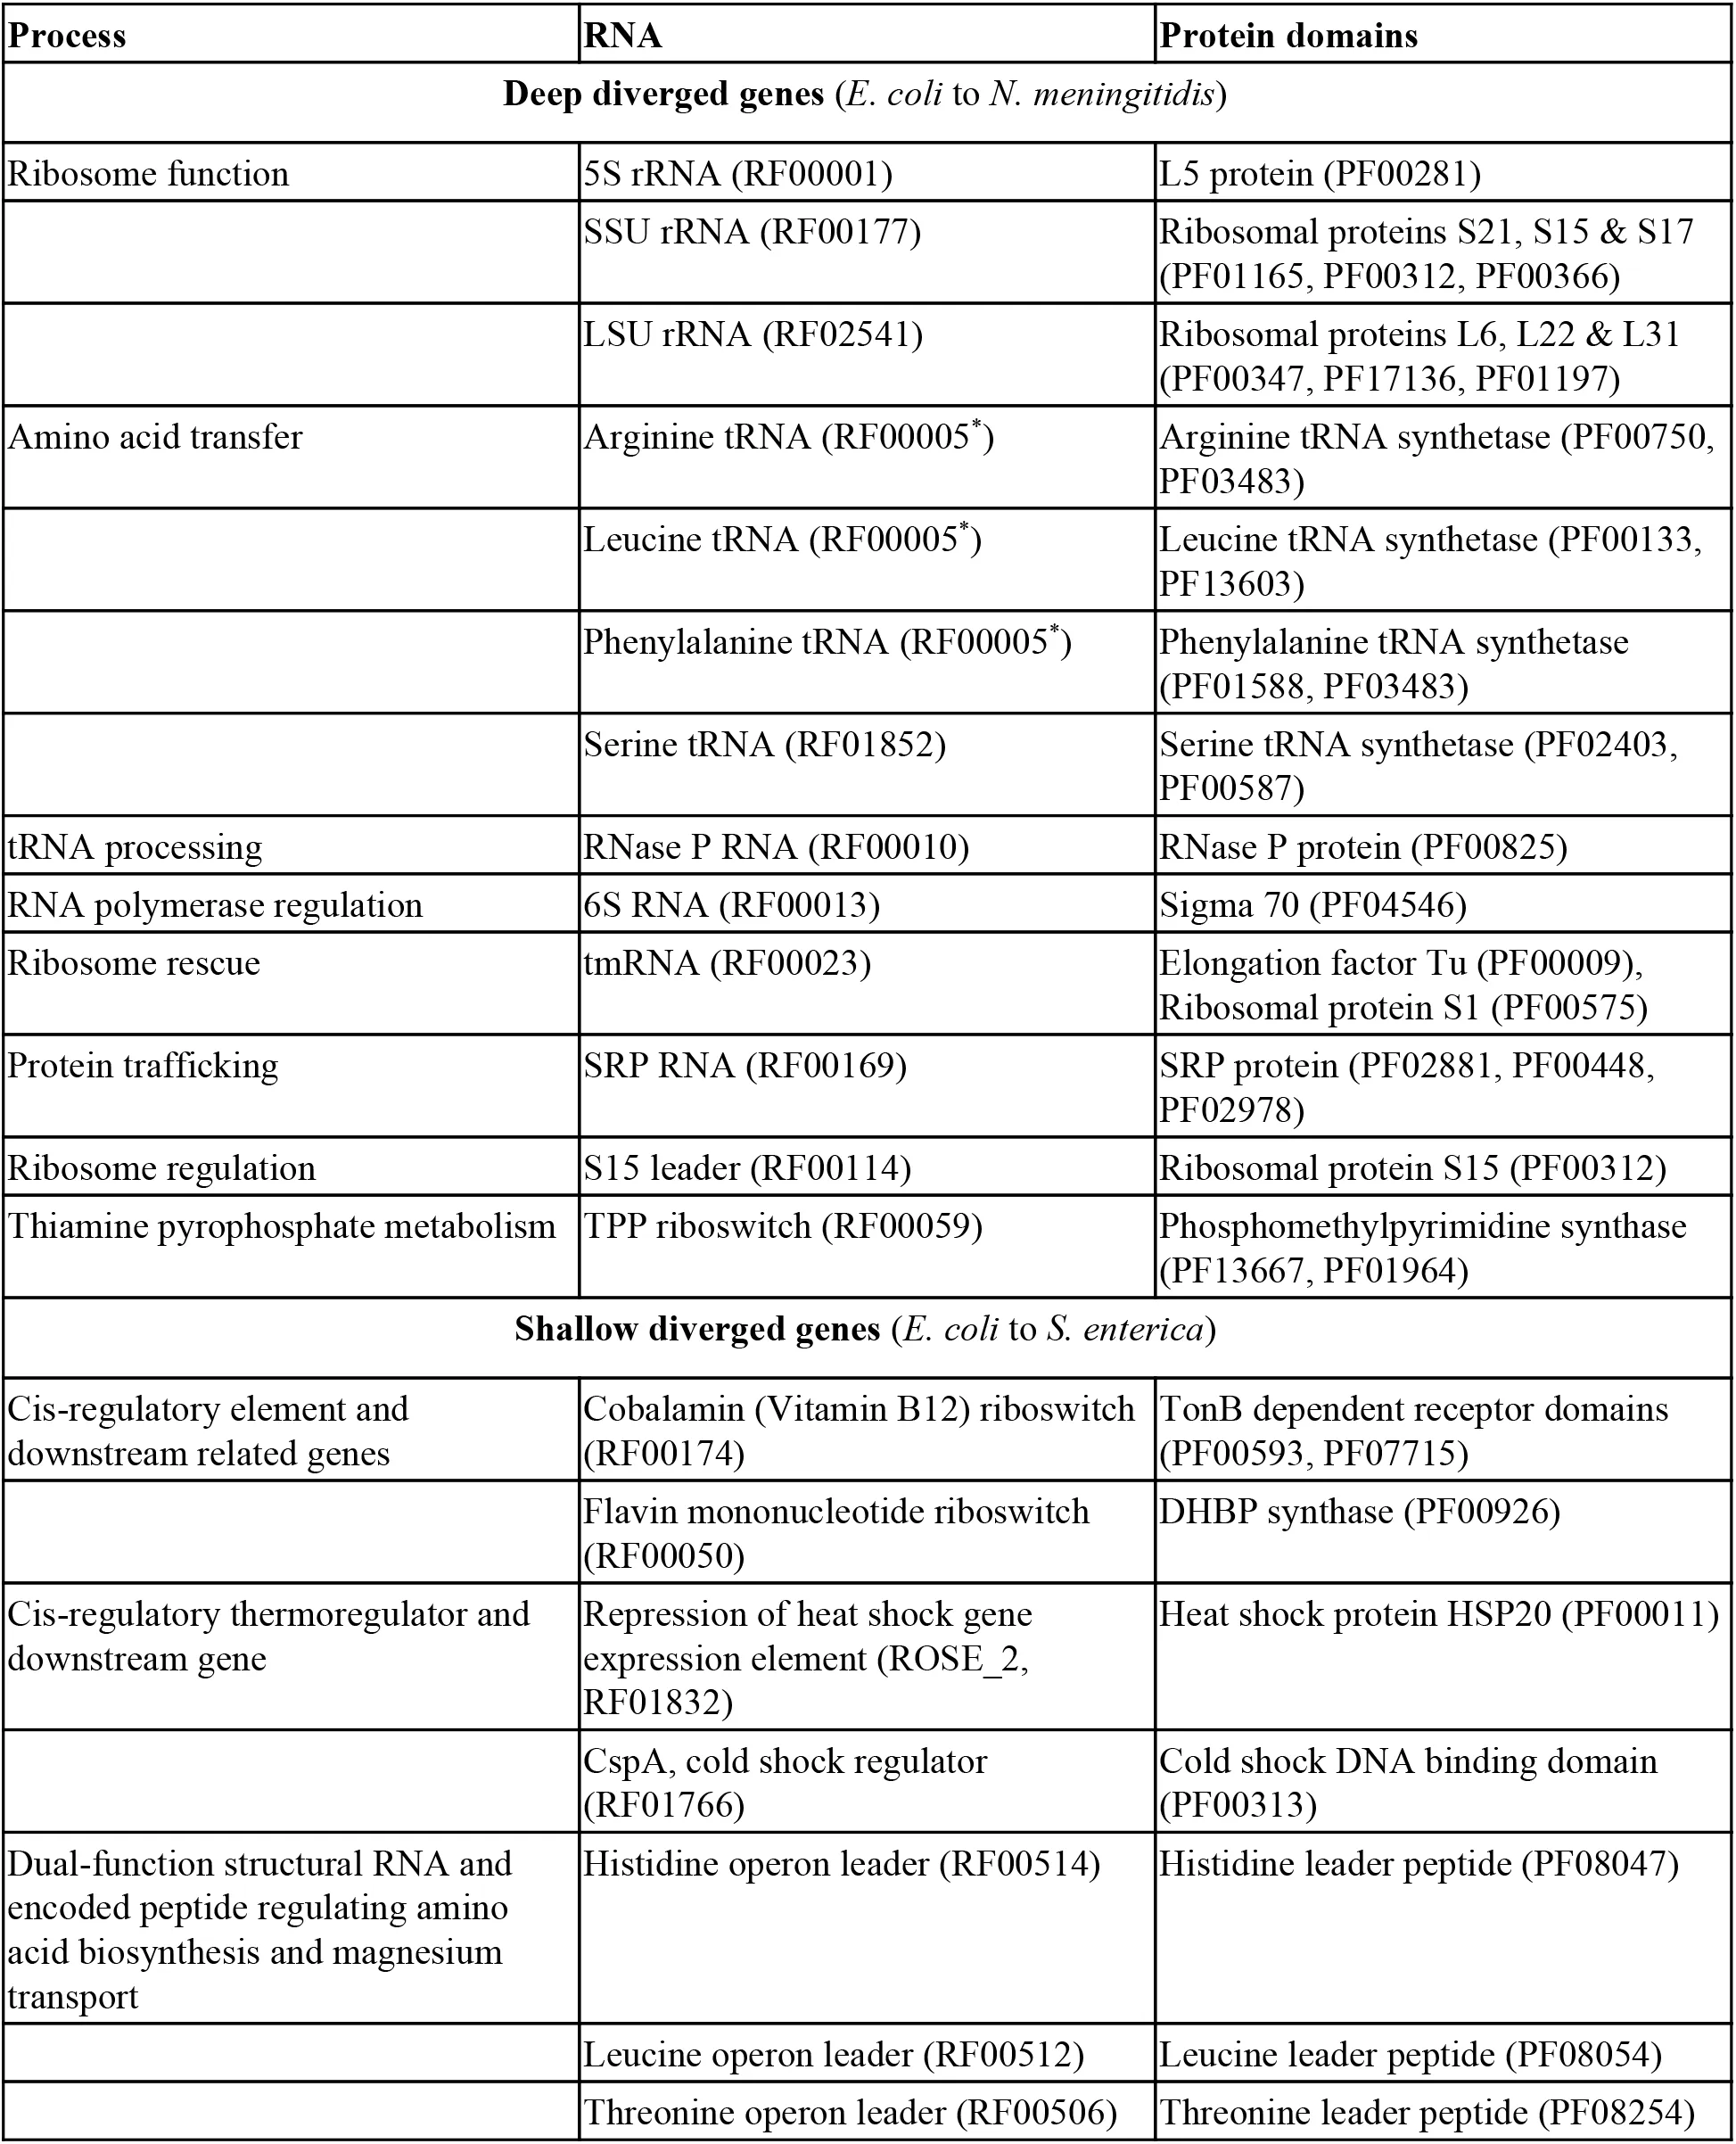
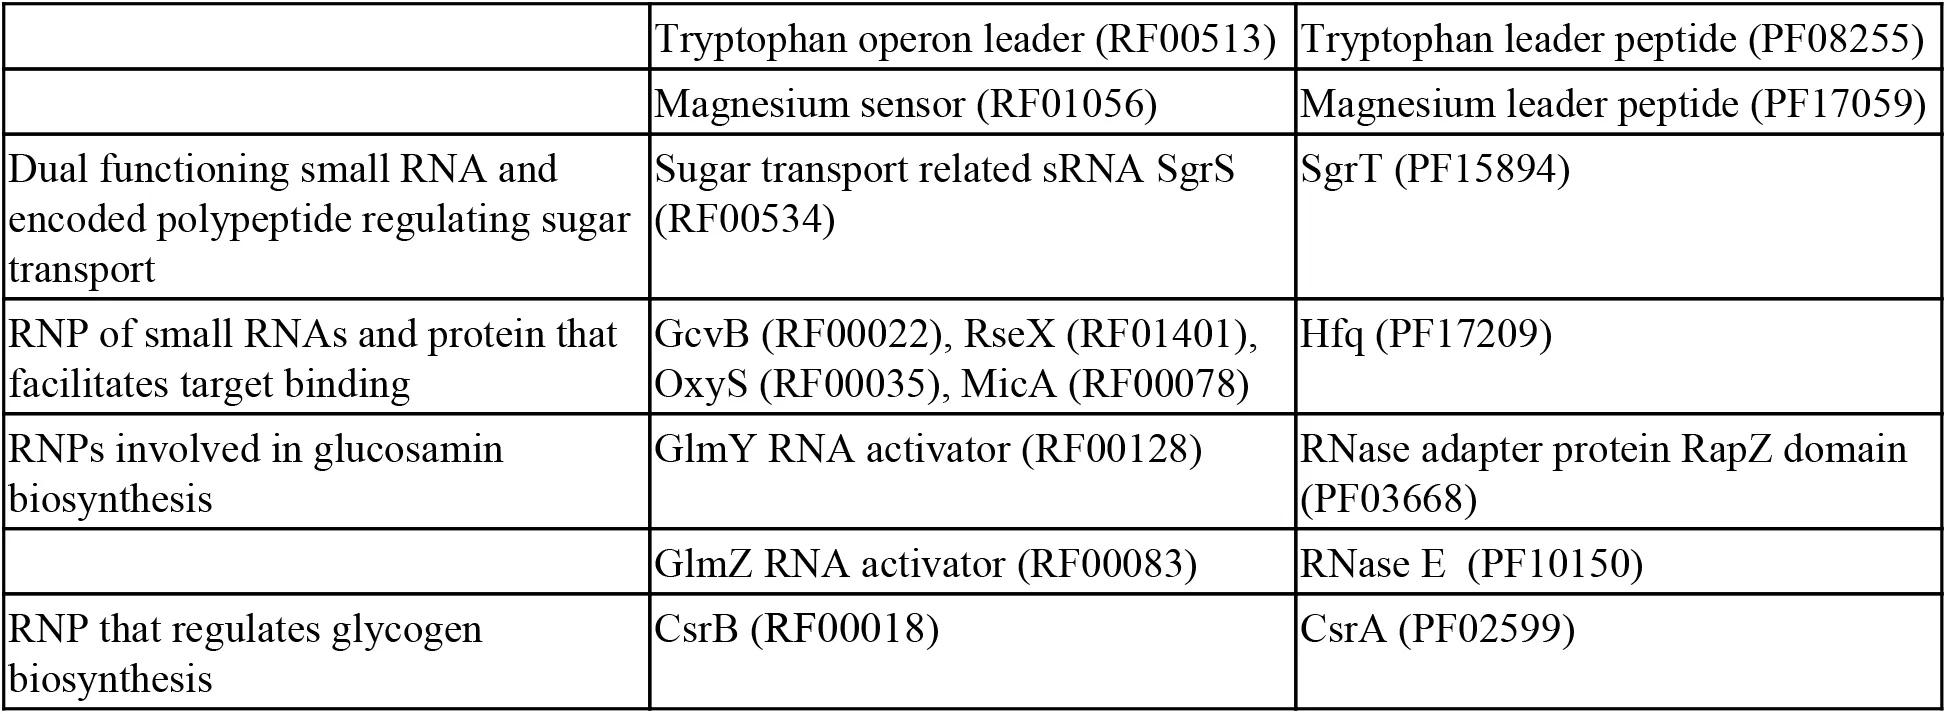
Our expectation is that nucleotide variation in RNAs and proteins between diverged species will indicate the degree of neutral variation that has occurred while the gene functions have been preserved. More robust genes are expected to tolerate more mutations over time. We have collected Rfam RNA and Pfam protein-domain pairs that are involved in the same biological processes Eddy et al., 2017Finn & others, 2016. These can be broadly classified as ribonucleotide particles (RNPs), cis-regulatory elements and their downstream protein gene pairs, and dual-function genes where one partner is modified or processed by the other (Table S1). These RNA and protein pairs have similar selection histories because of their shared functions, though their individual structural and/or catalytic constraints will vary.
We curated two lists of RNA:protein pairs and compared them across well-studied and annotated genomes. These pairs are distant enough to exhibit sequence diversity and have matched G+C contents (∼50%) (Figure 1B). We selected 25 RNA and protein-domain pairs that are deeply conserved and encoded in the genomes for Escherichia coli (U00096.3) and Neisseria meningitidis (AL157959.1). These two species are from the same phylum (Proteobacteria) but hail from different taxonomic classes (Gammaproteobacteria and Betaproteobacteria). The selected genes or domains are primarily core genes (e.g., ribosomal RNA and ribosomal proteins, tRNA and tRNA synthetases (Table S1)) involved in transcription or translation and are deeply conserved. We also collected 18 less-conserved ‘shallow’ pairs encoded in the genomes of E. coli and Salmonella enterica (AE014613.1), which are from the same family (Enterobacteriaceae) but different genera (Escherichia and Salmonella). These RNA and protein-domain pairs share a recent evolutionary history—Escherichia and Salmonella diverged approximately 150 million years ago Ochman et al., 1999 and represent families with limited phylogenetic distributions and possible tolerance of a high mutation rates because of a relaxed level of selection that is characteristic of new genes Long et al., 2003Cooper et al., 2010.
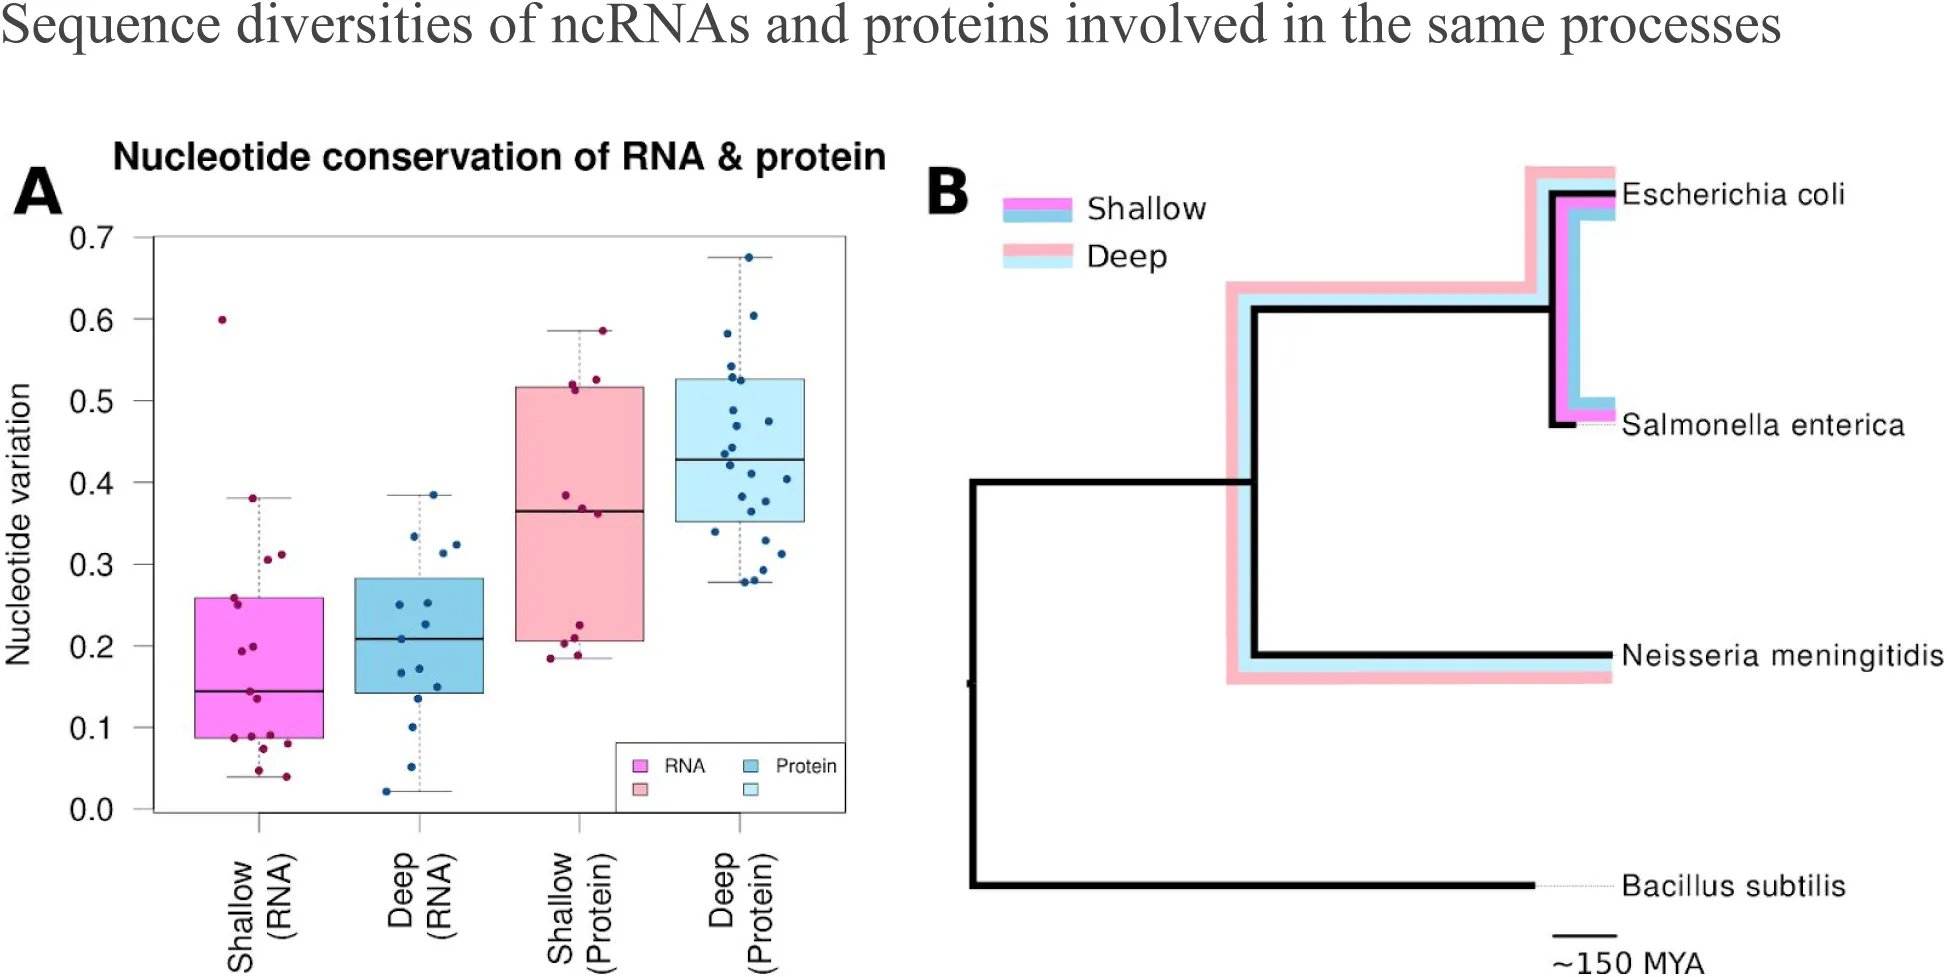
Figure 1:Proportion of variable nucleotides between shallow and deep divergence times for conserved RNA and protein families.
The proportion of nucleotide variation was tabulated for aligned orthologous RNAs (pink) and proteins (blue) from Escherichia coli and Neisseria meningitidis (deep divergence, lighter shades) or E. coli and Salmonella enterica (shallow divergence, darker shades). (A) Nucleotide variation is shown as the percentage of total nucleotides and indels that differ between the two species, with 50% indicating that half of the aligned positions differ. (B) The relationship between the deep (thin colored lines) and shallow (thick lines) diverged species on a 16S rRNA, dnaml Felsenstein, 1984, phylogenetic tree. It should be noted that the ‘shallow’ species diverged approximately 150 million years ago (MYA).
At each level of conservation, we computed the number of nucleotides that varied between the two species for a given gene. After normalizing by the length of the nucleotide sequence, we obtained a measure of the nucleotide variation for each gene. We then compared the sequence diversities of the conserved RNAs with those of matched protein-coding genes or domains (Figure 1). Each divergent nucleotide (mutation) was further classified as neutral or not, depending on whether it preserved secondary structure (RNA), amino acids (protein) and/or the biochemistry of the RNA or protein (Figure S1).
For both the shallow and deep groups, the number of mutations per nucleotide did not differ significantly between the proteins and RNAs (p = 0.4493 and 0.06965, respectively: Wilcoxon rank-sum test) (Figure 1). It is possible that interactions between the RNAs and proteins constrained the degree of variation between the two, with one of the pair evolving slower because it maintained interactions with a slowly evolving partner Fraser et al., 2002. We did not, however, see a correlation between the rate of nucleotide variation in a given RNA and its matched protein (Figure S2), leading us to conclude that this was most likely not the case.
The sequence diversity between populations provides an indication that a gene’s function is robust to changes in the nucleotide sequence. By this measure, RNAs and proteins exhibit similar degrees of robustness.
The nucleotide sequences of a representative E. coli ncRNA and protein were mutated in silico. BThe protein sequence was then translated, and the secondary structures of the ncRNA and protein mutants were predicted using in silico methods and compared with the predicted parent structures. This provided a measure of how robust the structure was to mutation. We selected a ncRNA:protein pair that met the following criteria: 1. Both the RNA and protein were structured, that is, the tertiary structure was important for function. 2. The RNA and protein were short as the computational requirements scale poorly with sequence length. 3. The protein structure was not contained in the Protein Data Bank (PDB) snapshot used by the protein secondary structure prediction (PSSpred) tool. The SgrS RNA (Rfam accession: RF00534, 227 nucleotides long) and corresponding SgrT protein (Pfam accession: PF15894, 102 nucleotides long) pair met these requirements. SgrS is an Hfq-binding, antisense regulatory RNA that encodes a short peptide, SgrT Wadler & Vanderpool, 2007. SgrS and SgrT act synergistically during periods of glucose-phosphate stress: the RNA binds to a number of messenger RNAs (mRNA) while the protein acts as a regulator Bobrovskyy & Vanderpool, 2014.
The per-residue secondary structure probabilities from “RNAfold-p” and “PSSpred” mutant sequences were compared with structure probabilities for the parental sequences. This gives a “structure rho” (Spearman’s correlation coefficient) score. SgrT and SgrS respond similarly to point mutations and indels. Both the RNA and protein mutants retained about half the parental structure (structure correlation of 0.5) on average at 100 point mutations per kilobase, though the protein showed a more variable response to mutation than RNA (Figure 2). The ability of folded proteins to undergo structure flips from predominantly helical to alternative conformations results in a greater number of negative correlations. There were a small number of indels that had a stronger effect than point mutations, but the correlations of RNA and protein still reached 0.5 with approximately 100 indels per kilobase. The protein was slightly more sensitive to indels than RNA, but showed a similar overall level of decline in its structure. The truncated proteins (triangles, Figure 2), are the result of premature stop codons. These cause small sample size effects resulting in more extreme correlations (both high and low).
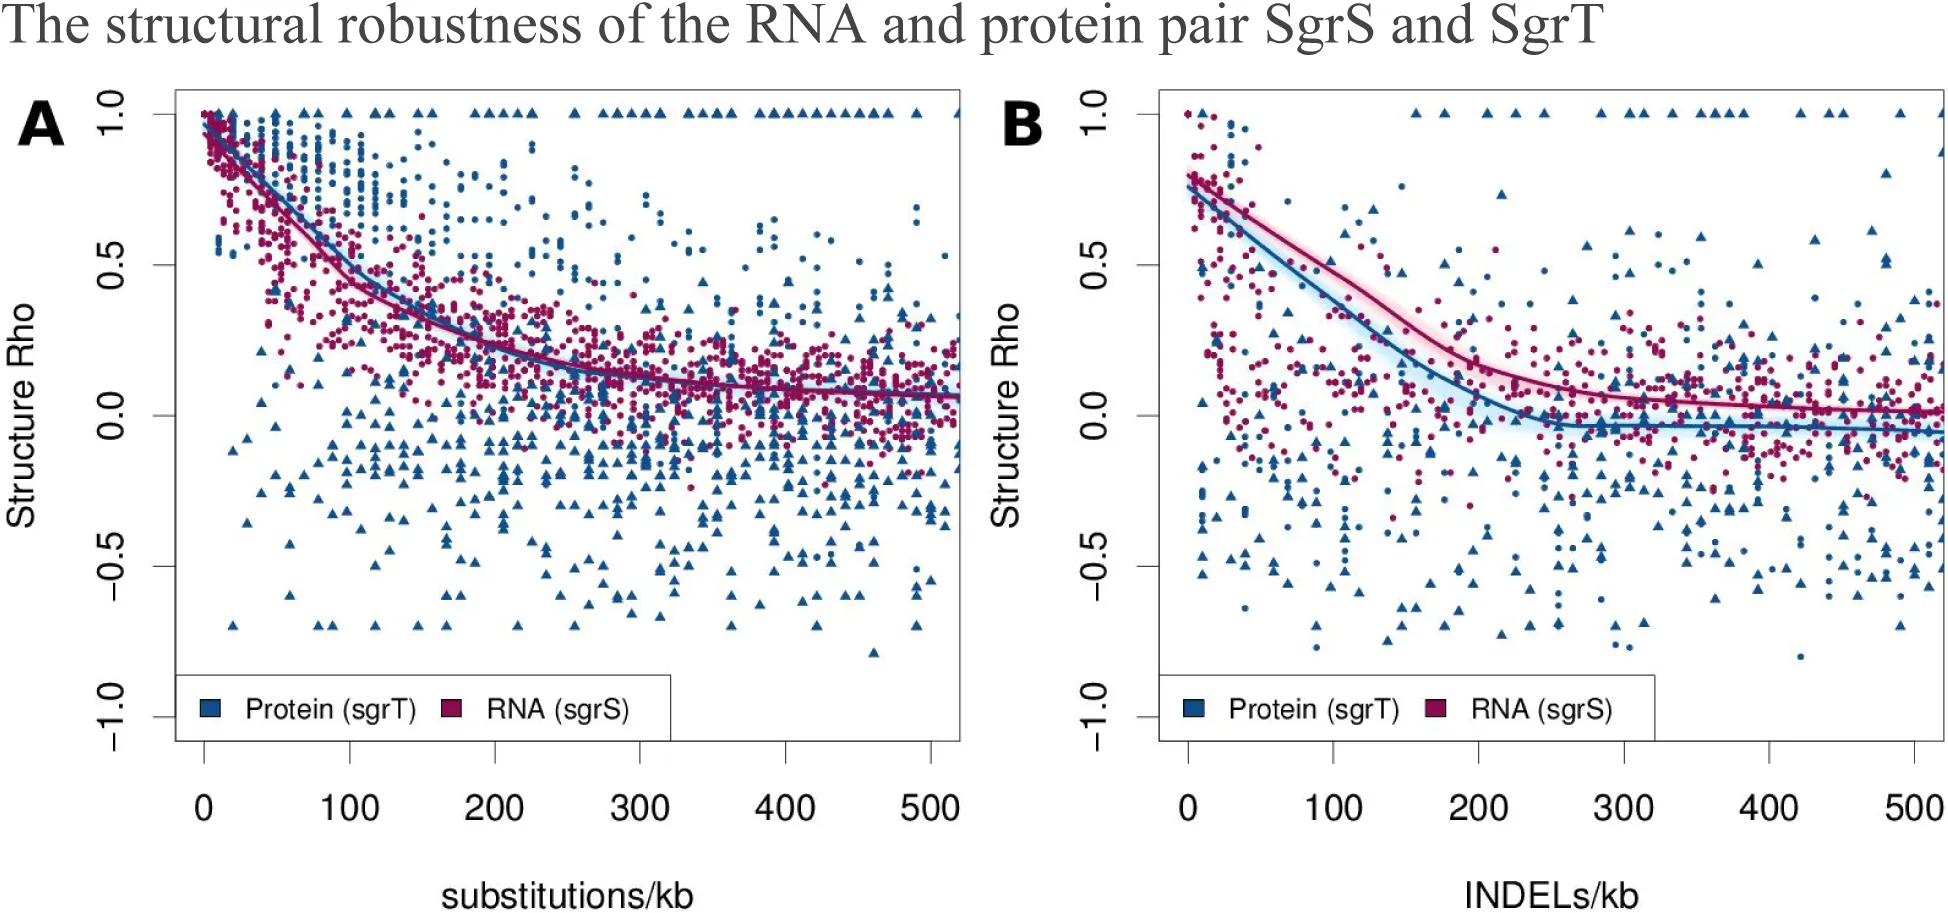
Figure 2:Robustness of structure predictions to random in silico mutagenesis for a protein (SgrT) and non-coding RNA (SgrS).
Random mutants of the SgrT messenger RNA (blue) and the SgrS small RNA (pink) were generated in silico. Secondary structure probabilities for each were predicted using “PSSpred” and “RNAfold-p”. The per-residue probabilities of alpha/beta/coil structures (protein) or base-paired/not-base-paired (RNA) were compared between native and mutated sequences using Spearman’s correlation. This gives a “structure rho”, where 1 implies the predicted mutant structure is identical to the predicted parental structure, 0 means there is no correlation between the two, and −1 corresponds to a perfect inverse correlation. (A) Substitution mutations and (B) insertion or deletion mutations (indels) were introduced into the protein (blue) and RNA (pink) at rates ranging from 1 to 500 mutations per kilobase (kb). Points corresponding to truncated protein or sRNA with a length less than 75% that of the original are indicated with a solid triangle, otherwise a solid circle is used. The average trends between mutation rates and structure rho are indicated with local polynomial regression (loess) curves. To indicate the confidence for each loess curve, these were bootstrapped 500 times and plotted in light pink or blue to resampled points.
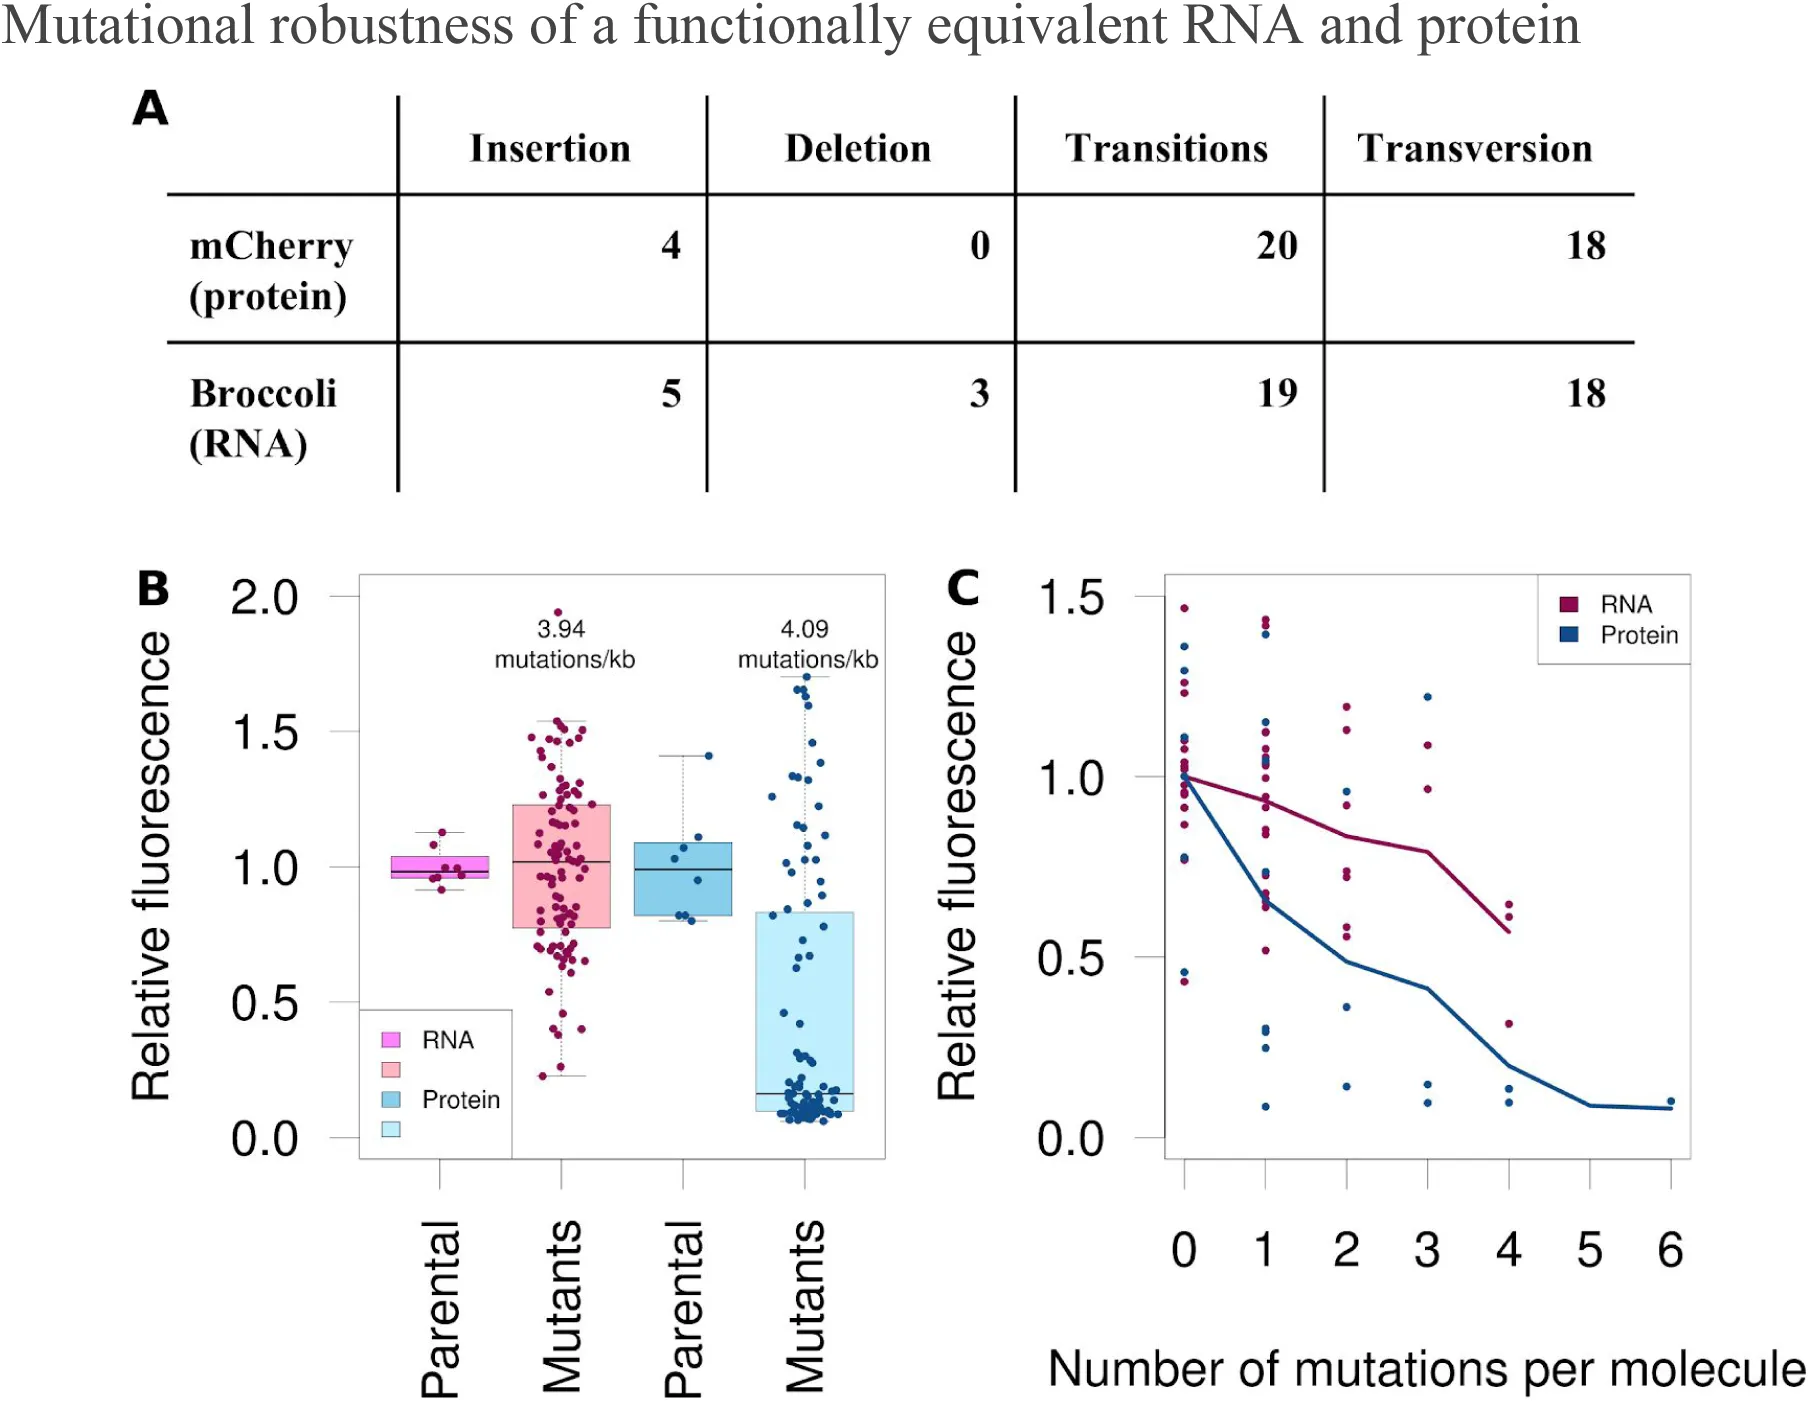
Figure 3:Relative fluorescence intensities of mutated RNA Broccoli and mutated protein mCherry.
We generated libraries of the randomly mutated fluorescent RNA aptamer Broccoli and fluorescent protein mCherry, which we then tested for function relative to an unmutated control. (A) The mCherry and Broccoli libraries were matched for similar rates of mutations per kilobase (kb) (4.09 and 3.94, respectively) using an error-prone PCR protocol. The fluorescence intensities for 96 mutants each of the RNA and protein were compared with those for eight unmutated controls. Measurements were recorded for three separate replicates. (B) Individual molecules of mCherry and Broccoli mutants were sequenced and their fluorescence compared using the number of mutations per molecule (zero to six). (C) We counted the different types of variants that were observed in the sequenced mutants.
The structure analysis may be influenced by differences in the RNA and protein structure prediction methods. The protein structure inference uses automatically generated sequence alignments with a snapshot of the National Center for Biotechnology Information’s (NCBI) non-redundant (NR) protein sequence database, plus a machine-learning method to estimate the probabilities of different secondary structure elements Zhang, n.d.. By contrast, the RNA structure inference is solely based on the sequence, and uses a nearest-neighbour energy model Zuker & Stiegler, 1981McCaskill, 1990. RNA folding is notoriously difficult as small parameter changes (in the energy model or sequence) can result in very different minimum free energy structure predictions. However, our approach, which is based on the Boltzmann distribution, can somewhat mitigate this issue Rogers et al., 2017 by selecting a protein with few homologs in the NR and PDB databases. We ran the same analysis with the CsrA/CsrB protein:RNA pair (Figure S3), which do have protein homologs in the databases. As expected this showed an increase in protein robustness, which was likely due to matches with CsrA homologs in the NR database and the solved CsrA structure in the PDB, in spite of the random mutations we introduced.
This result is a measure of predicted structural robustness. It is possible that the structure could be maintained but function lost, or that some molecules may continue to function better than others despite changes in structure (i.e., they are more robust). Therefore, we also tested for robustness of function. To do this, we mutated an RNA and a protein matched for an assayable function (fluorescence) and tested these mutations in vivo.
To investigate how biomolecules may differ in their robustness to mutations in DNA, we constructed mutant libraries of the fluorescent RNA aptamer Broccoli You & Jaffrey, 2015Filonov et al., 2014 and the fluorescent protein mCherry Tsien, 1998. Both these molecules have been developed synthetically in the laboratory, and have not been subjected to strong evolutionary pressure outside of fluorescence. With a mutation frequency of approximately four mutations per kilobase, the relative fluorescence intensity for the population of Broccoli mutants was significantly (P = 1.5 × 10⁻¹³, Wilcoxon rank-sum test) more than that for mCherry (Figure 1A). Though the median fluorescence of the Broccoli population decreased slightly as the frequency of mutations increased, even at six mutations per kilobase, the Broccoli library had higher relative fluorescence intensities than the mCherry library with four mutations per kilobase (Figure S3). At 234 bases, the gene for Broccoli is much shorter than that for mCherry (711 bp). We sequenced approximately 40 molecules from each library and compared the number of mutations per molecule. Broccoli retained more of its fluorescence than mCherry with the same amount of mutations per molecule (Figure 1B). The frequencies of different types of mutations that occurred in the biomolecules were roughly similar, with few insertions or deletions (indels) and similar numbers of transitions and transversions.
3Discussion
We hypothesized that RNA would be more robust to mutation than proteins. This is supported by the fact that RNA often requires less processing than protein to produce functional molecules Mattick & Makunin, 2006, is not susceptible to frameshift mutations Hershberg et al., 2003 and is less likely to be found over broad evolutionary distances with homology searches, possibly because of generally higher mutation rates Lindgreen & others, 2014. Our multi-scale tests of RNA and protein robustness revealed no consistent evidence that RNAs are more robust than proteins.
If RNAs were more robust than proteins, we would expect phylogenetically and functionally matched RNA families to have more nucleotide diversity than proteins of the same evolutionary background. By comparing the diversity of extant RNAs and proteins, we found that they actually had similar rates of nucleotide substitution. This was true across both highly conserved and more recently acquired interacting protein and RNA families. Individual RNAs and proteins tested directly for robustness to mutation through mutagenesis gave variable results. When the fluorescent protein mCherry and fluorescent RNA Broccoli were tested in vivo, the protein was significantly less robust than RNA to substitution mutations. By contrast, the predicted structural probabilities of the matched RNA and protein SgrS and SgrT showed that both substitution and insertion or deletion mutations degraded the structures at very similar rates.
The genetic robustness of proteins is unexpected for a few reasons. Proteins differ from RNAs in that they must be translated as well as transcribed, potentially making them more sensitive to mutations, particularly frameshifts. Robustness against translational errors reduces the chance of creating misfolded proteins but adds additional constraints to the nucleotide sequence and actually reduces the nucleotide diversity in highly expressed, highly translated proteins in yeast and bacteria Drummond, 2005. We then speculated that proteins would have less sequence diversity than RNAs, which are not translated at all. Instead, we found that the proteins had at least as much sequence diversity as matching RNAs. Additionally, indel mutations can cause frameshifts in proteins, changing all downstream amino acids. RNA, having no code to protect, could potentially absorb additional nucleotides in bulges, leaving nucleotides out of stems Mimouni et al., 2009Nawrocki & Eddy, 2007Eddy & Durbin, 1994 without dramatically affecting other regions of the RNA structure. Nonetheless, the predicted structures for RNAs were as sensitive to indels as the proteins. The extant genetic code is more robust to frameshifts than randomly generated genetic codes Geyer & Madany Mamlouk, 2018, and it seems to confer more robustness than plasticity within RNA.
One test that stood out from the others was our functional test with the fluorescent RNA aptamer Broccoli and fluorescent protein mCherry. Here, the Broccoli RNA was more robust than the mCherry protein. We used a double Broccoli aptamer, which means a mutation in one half could leave the other half with some functionality. Otherwise, the difference could be caused by the individual natures of the molecules tested. Robustness varies significantly between individuals because of many factors, including the stability of the molecule Guo et al., 2004Abrusán & Marsh, 2016Carothers et al., 2004, the need to preserve interactions with other molecules and the expression level Drummond, 2005Omer et al., 2017. Both entire molecules and regions within molecules benefit from stability as it provides some buffer for destabilization caused by a mutation Abrusán & Marsh, 2016Bloom et al., 2006 and helps the molecule maintain its structure. Using thermodynamic models of secondary structure in RNA and experiments with small RNA viroids, stems were found to be more robust than loops and to stabilize the structure of the molecule as a whole Sanjuan, 2006Wuchty et al., 1999Li et al., 2016. In proteins, alpha helices were more robust than beta strands and both were more robust than unstructured coils, primarily because of the higher number of residue interactions in helices than strands or coils Guo et al., 2004Abrusán & Marsh, 2016.
Our investigation of the comparative robustness of RNAs and proteins was, in part, initiated by the observation that RNAs and proteins are differentially distributed across phylogenetic distances Lindgreen & others, 2014. We proposed that this might be due to rapid nucleotide divergence of functional RNAs making them difficult to detect, but we did not observe any significant difference in the level of nucleotide variation between RNAs and proteins at matched evolutionary divergences. Furthermore, we found no convincing evidence that RNAs are more robust to mutagenesis as a whole. If RNAs are not more robust than proteins, as our experiments imply, the more likely explanation for differences in phylogenetic distributions is that a protein homology search is statistically more powerful than that for nucleotides Rost, 1999Gardner et al., 2005 and that gene turnover and neofunctionalization are more rapid for RNAs than for proteins.
This is the first experimentally driven comparison of the robustness of RNAs and proteins. Previous comparisons have involved computational analysis of neutral networks: a collection of related sequences that give rise to the same phenotype. Earlier analysis using reduced genetic codes (e.g., G+C for RNA and hydrophobic:hydrophilic for protein) Ferrada & Wagner, 2012Greenbury et al., 2016Babajide et al., 1997Ahnert, 2017, found that RNA networks differed quantitatively and qualitatively from protein networks. More recently, Greenbury et al. found this to be dependent on the mathematical framework used, and suggested that RNAs and proteins were more similar Greenbury et al., 2016Ahnert, 2017. Our work corroborates this, suggesting that RNAs and proteins have similar overall robustness to mutation. This does not mean that RNAs and proteins do not differ in their responses to mutation, but that these differences at least tend to even out. The majority of RNA mutations preserve base-pairing relationships, while the majority of protein mutations preserve the biochemistry of the coded amino acid structure. Both of these ultimately preserve the molecule’s structure (Figure S2). It has been proposed that protein networks are disconnected, with each phenotype separated from other phenotypes by a span of non-functional space. By contrast, RNA is more interconnected, with phenotypes close to each other in sequence space Ferrada & Wagner, 2012Ahnert, 2017. Such differences in neutral networks could mean that RNAs could both lose and gain functions more easily than proteins Ferrada & Wagner, 2012Goldstein, 2008
Future theoretical and experimental treatments are needed to explore the initial results presented here. Acknowledging the limitations of using just one RNA and protein pair for analysis, mutagenesis could be repeated with different RNAs (e.g., Spinach Paige et al., 2011, iSpinach Autour et al., 2016, Mango Dolgosheina & others, 2014) and phylogenetically distinct proteins (e.g., GFP, luciferase, ZsGreen1, ZsYellow1 Introduction to Fluorescent Proteins Nikon’s MicroscopyU, n.d.). Additional comparisons of in silico structural robustness could utilize Boltzmann structure ensembles for structural comparisons and methods similar to FATHMM (Functional Analysis through Hidden Markhov Models) for estimations of neutral mutations.
Simulated evolution experiments could be performed to identify differences in RNA and protein evolvability as well as mutational robustness. For example, starting from random pools of sequences, RNAs and proteins could be compared directly using systematic evolution of ligands by exponential enrichment (SELEX) for RNAs Ellington & Szostak, 1990 and directed evolution for proteins Arnold, 1998Jakociunas et al., 2018. This approach may also be modeled computationally using methods akin to genetic algorithms, such as the flow reactor, which iteratively optimizes a random pool of sequences to fold into predetermined predicted structures Fontana & Schuster, 1998Schuster, 2001. Forms of robustness other than mutational robustness, like the robustness of RNA and protein interaction networks, could also be explored.
Robustness interplays strongly with evolvability Greenbury et al., 2016Bloom et al., 2006McBride et al., 2008Lenski et al., 2006, and work on this topic can inform our understanding of how new functions evolve in proteins and RNAs going back to the evolution of life itself. How did early biomolecules function in what is likely to have been a high mutation environment Kun et al., 2005, and would robustness to mutation have affected the transition from an RNA world to a protein world? Robustness can also help us look into the future, as we engineer smart biomolecules capable of functioning within the host cell despite inevitable mutations. While RNA and protein may not differ quantifiably in robustness, such qualifiable differences will further our understanding of the rise and fall of new functions and families of self-replicating biomolecules.
4Methods
We devised three tests to explore the relative robustness of ncRNA and protein. First, we considered the degree of sequence change between matched RNAs and proteins that were either shallow (recently diverged) or deep (conserved) (Natural variation of ncRNA:protein systems), and classified these changes as either neutral or not (Classification of near-neutral variation). Second, we tested robustness to mutation directly by mutating a specific protein and RNA pair and testing their structural robustness in silico (Simulated variation and ribonucleoprotein secondary structure). Finally, we tested an ncRNA and protein pair and tested their functional robustness in vivo (Fluorescent protein and RNA comparison).
4.1Natural variation of functional ncRNA:protein systems
We selected pairs of RNA and protein families from Rfam and Pfam that were linked by either direct interactions or by process, and conserved over either deep phylogenetic distances (between E. coli and N. meningitidis) or shallow phylogenetic distances (between E. coli and S. enterica). The pairs included directly-interacting RNAs and proteins (components of the ribosome, RNAse P and SRP); cis-regulatory elements and their downstream genes (e.g., the cobalamin riboswitch and the TonB-dependent receptor involved in cobalamin uptake); and dual-function genes that encode both proteins and structured ncRNAs (e.g., the tryptophan operon leader and SgrS). The full list of partners is detailed in Table S1. Each pair of deep or shallow diverged nucleotide sequences was aligned, either using a Rfam covariance mode Eddy et al., 2017 and cmalign Nawrocki & Eddy, 2013 or, for the protein domains, using hmmalign (v3.1b2) Eddy, 2011 and concordant codon-aware nucleotide alignments generated with PAL2NAL Suyama et al., 2006. The number of variant sites was recorded for each alignment and each variant was classified as either neutral or not, based upon a number of structural and biochemical models (see Figures 1 and 2).
4.2Classification of near-neutral variation
For RNA, we considered two models of near-neutral mutation. The first, which we describe as biochemically “neutral”, incorporated transition mutations. That is, purines replacing purines and pyrimidines replacing pyrimidines (A<->G and U<->C). The second model took into account the consensus RNA secondary structure, defining as neutral mutations in loop regions and those that are structurally neutral, either compensated for by a covarying site or by a wobble mutation (e.g., A:U <-> G:U <-> G:C). For proteins, we considered three models of near-neutral mutation. The first, which we describe as “degeneracy”, identified mutations that did not change the genetic code (i.e., synonymous mutations) and those that changed the amino acid sequences (i.e., non-synonymous mutations). The second model (BANP) coded amino acid sequences into a four-letter alphabet that split the amino acids into the following broad categories: basic (B = H or R), acidic (A = D or E), non-polar (N = A, F, L, I, M, P, V or W), and polar (P = C, N, Q, S, T or Y). Nucleotide variations that did not change the BANP sequences were considered neutral, and changes that altered it were considered non-neutral. Finally, the “blosum” model considered each nucleotide change. Those changes that resulted in an amino acid replacement and had a positive score in the BLOSUM62 matrix Henikoff & Henikoff, 1992 were considered neutral. By contrast, those replacements that had a score of zero or less were considered non-neutral.
4.3Simulated variation and ribonucleoprotein secondary structure
We mutated E. coli CsrB RNA and CsrA protein in silco and computed the abilities of these mutants to maintain their secondary structures. Both molecules are comparatively short (360 nucleotides and 52 amino acids for CsrB and CsrA, respectively), which made the following computation possible. For CsrA and CsrB, the DNA sequences were replicated with random mutations 100 times using a Perl (v5.26) script (structureMutagenerator.pl). The mutations were either substitutions or indels and the mutation rate was between 0 and 500 per kilobase. To predict the secondary structures of these mutants, we used PSSpred to infer the probability of each residue in a protein sequence forming an alpha helix, beta sheet or coil Yan et al., 2013Yang & others, 2015. PSSpred uses multiple sequence alignments from PSI-BLAST searches of the NCBI NR database. The resulting alignments are fed to a combination of seven neural network predictors, which are trained to infer structures from profiles. For the RNA sequences, we used “RNAfold-p”, an implementation of McCaskill’s RNA partition folding function McCaskill, 1990 found in the Vienna RNA Package Lorenz & others, 2011.
4.4Fluorescent protein and RNA Plasmid and Library construction
The fluorescent protein vector was constructed by inserting the mCherry gene into the NcoI and PmeI sites of pBAD-TOPO/LacZ/V5-His (Invitrogen) deriving pMCH01 (PBAD-mCherry, pBR322+ROP backbone, AmpR). Plasmid pBRC01 (T7-Broccoli-Broccoli, pBR322+ROP backbone, KanR) was purchased as pET28c-F30-2xdBroccoli (Addgene). Mutagenesis libraries were constructed using GeneMorph II Random Mutagenesis Kit (Agilent Technologies). The mCherry gene and Broccoli aptamer were amplified from their respective plasmids using Mutazyme II DNA polymerase to generate mega primers for MEGAWHOP whole plasmid PCR Miyazaki, 2011. Parental plasmids were digested with restriction enzyme DpnI, and the resulting mutation library was introduced into competent E. coli BL21(DE3) (Broccoli) or E. coli BL21(DE3) pLys (mCherry). We constructed two mCherry libraries with mutation rates of approximately one and four mutations per kilobase, and three Broccoli libraries with mutation rates of four, five and six mutation per kilobase. Approximately 10 clones from each library were sequenced to determine the mutation frequencies and whether the mutations were indels, transitions or transversions. Individual clones (n = 96) from each library were frozen for later analyses.
4.5Fluorescent protein and RNA Fluorescence measurements
Cultures were grown at 37°C in Luria Bertani broth supplemented with appropriate antibiotics in a dry shaking incubator at 150 rpm. Each library was grown overnight in a 96-well plate before transfer to a second plate containing fresh medium supplemented with 1 mM isopropyl β-D-1-thiogalactopyranoside (IPTG) and 200 μM DHFB-T1 (Lucerna) to induce expression of Broccoli or 0.2% arabinose to induce expression of mCherry. We also prepared a plate containing eight wells of induced parental constructs (positive), uninduced parental constructs (negative), and LB supplemented with inducers (blank) for controls. The next morning, each library plate was used to culture three independent replica plates (three total cultures per mutant) and the control plate was used to culture one replica plate (eight total cultures per control condition). All plates were grown for 6 h before a Fluostar Omega plate reader (BMG Labtech) was used to measure the optical density (600 nm) and fluorescence. Fluorescence for the mCherry mutant library was measured with a 584 nm excitation filter and a 620 nm emission filter, with a 1500 gain. Fluorescence for the Broccoli mutant library was measured with a 485 nm excitation filter and a 520 nm emission filter, with a 1000 gain. Relative fluorescent units (RFU) was divided by optical density to derive a “Growth modified RFU”, and then by no-mutant controls to get the “Relative Fluorescence”. The no-mutant controls for the libraries were the parental plasmids and the no-mutant controls for the individual clones were unmutated clones within the library.
5Data and software availability
All the software, documentation, sequences, and results for this project are available on our github repository: https://
Furthermore, the datasets used to generate Figures 1–3 and S2 are available in the following Google Sheet: https://
6Supplementary Material
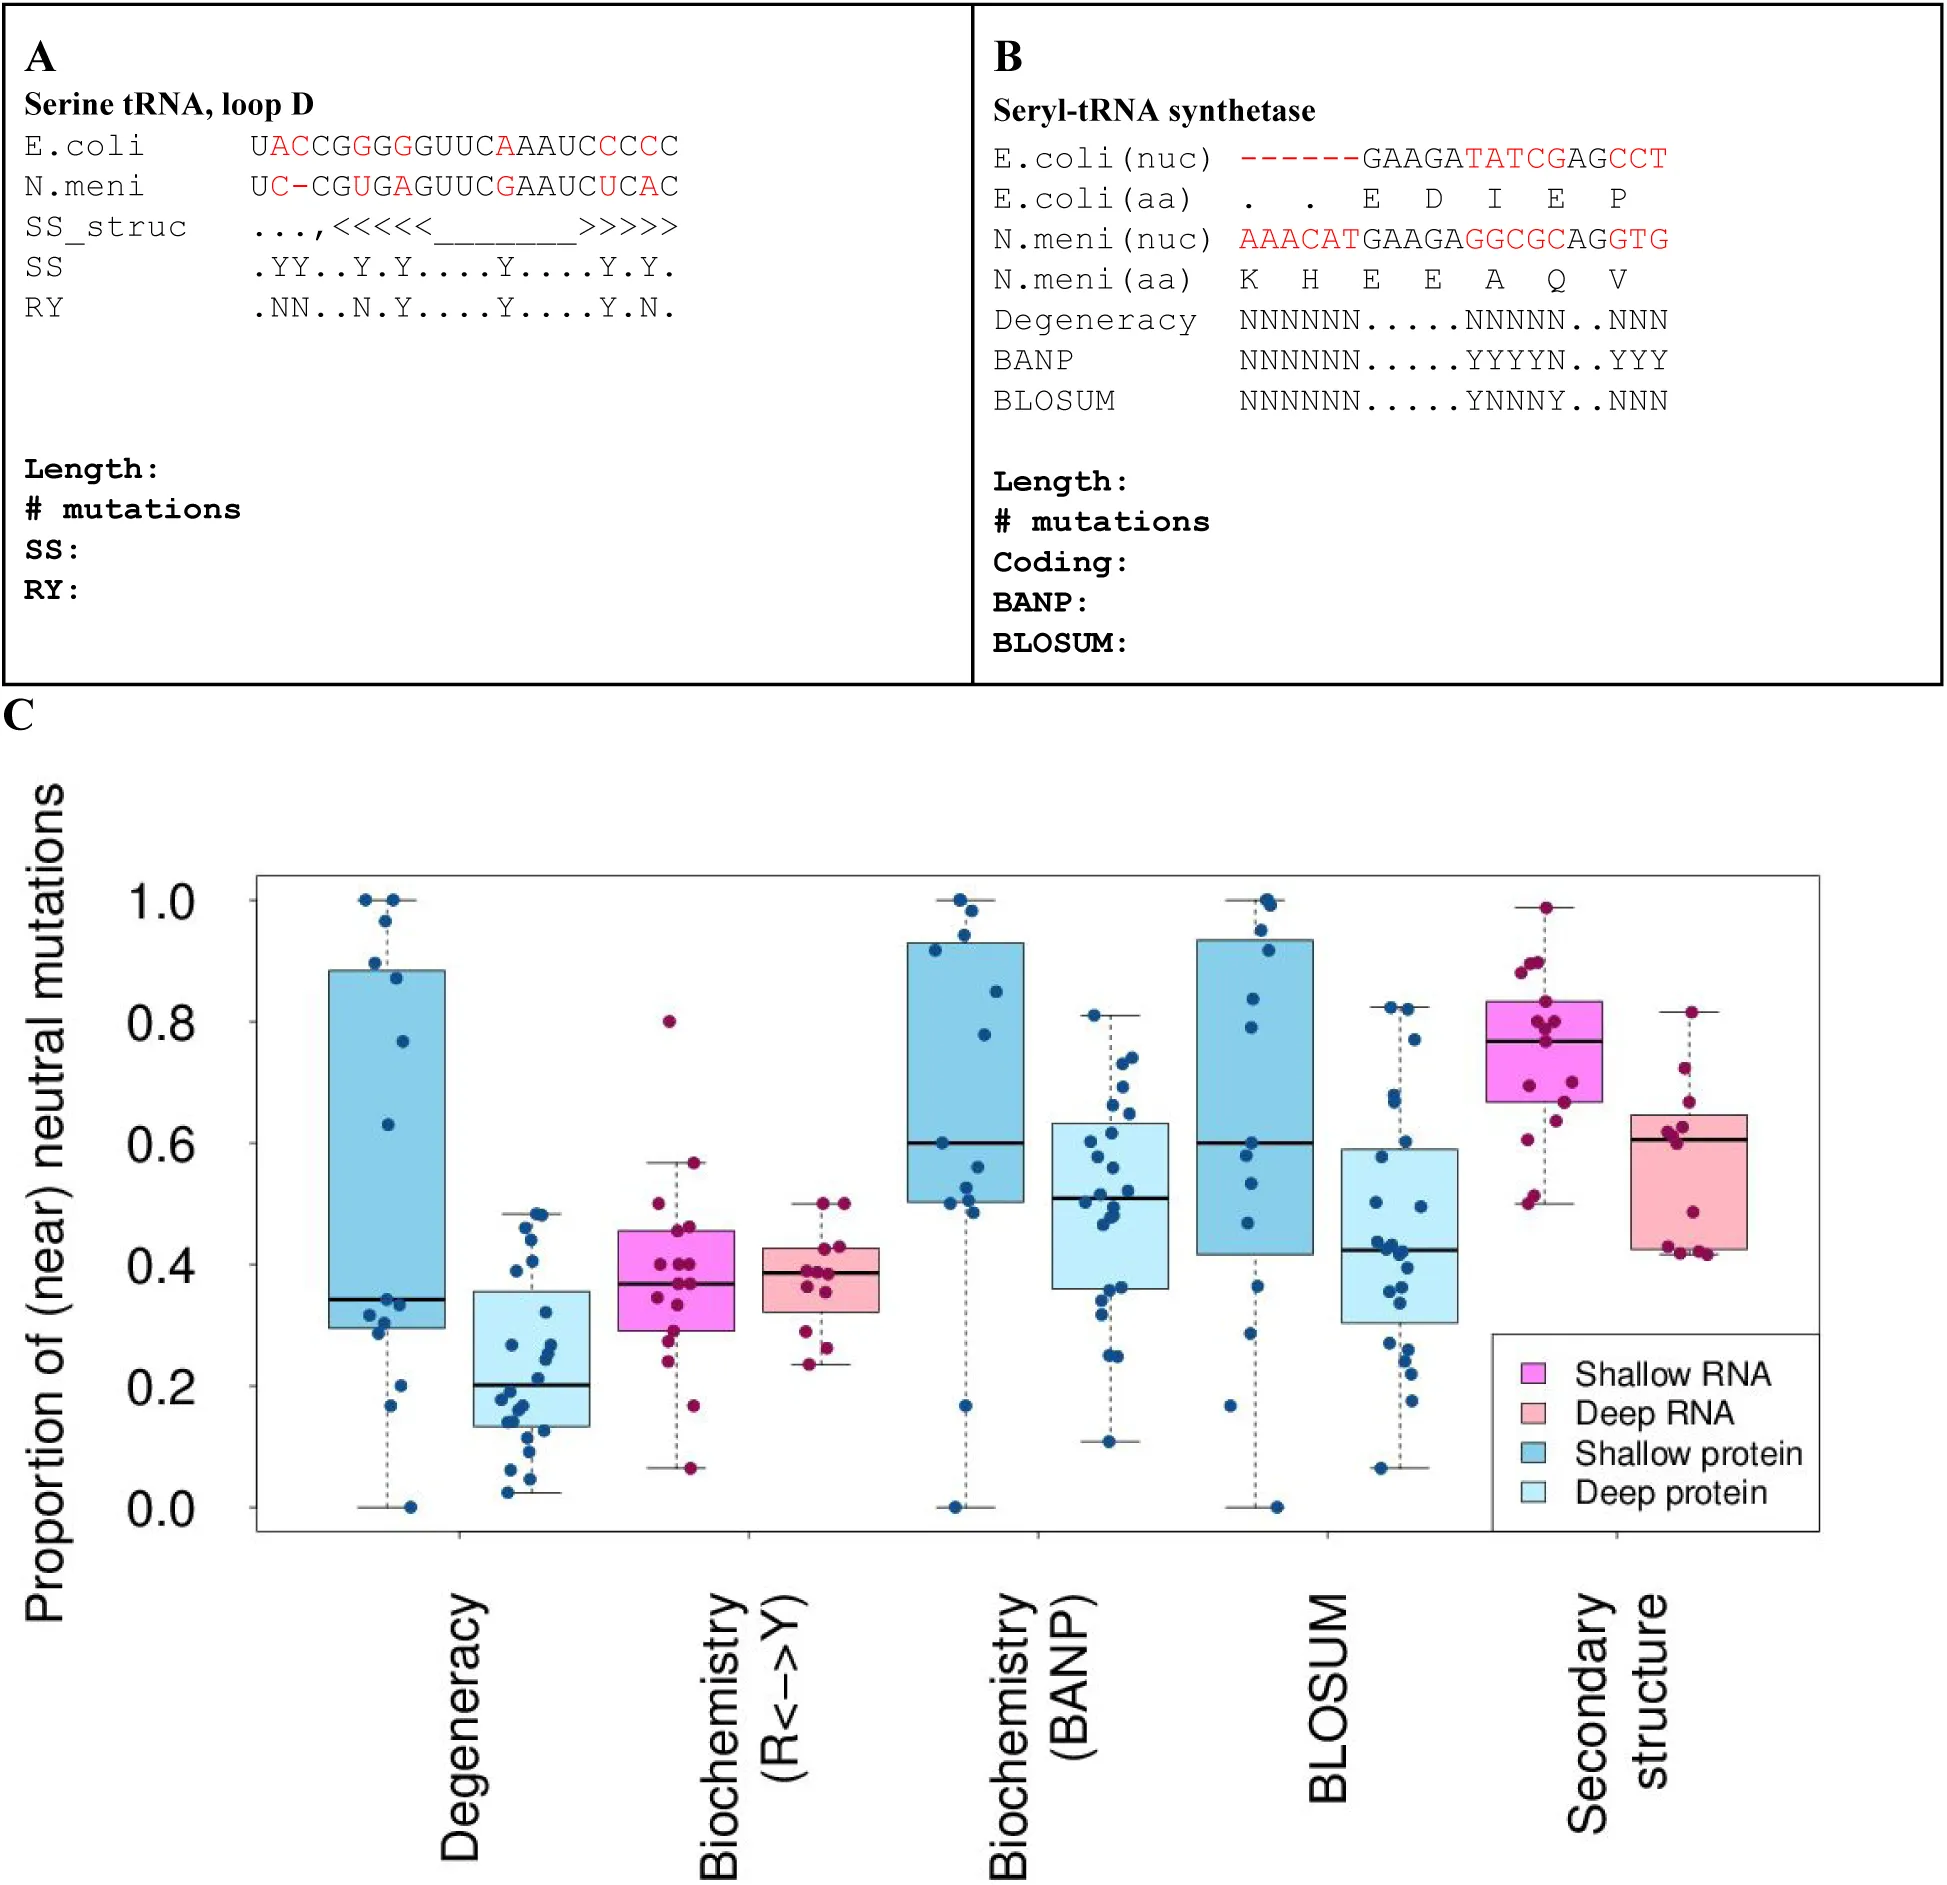
Figure 4:The proportion of nucleotide variants in RNA or protein that can be classed as neutral.
A collection of functionally linked RNA and protein families that are shared between E. coli and N. meningitidis (N. meni) (Deep, lighter shades) or between E. coli and S. enterica (Shallow, darker shades). Each nucleotide variant is classified as either neutral or non-neutral according to a number of different models. (A&B) Exemplar genome variants and different classification schemes. (A) To score differences in the RNA serine tRNA, for example, secondary structure of each was determined (SS_struct) and changes between species (in red) was scored as either near-neutral or not, for changes in secondary structure (SS or Secondary structure) or biochemistry (RY show transitions, R: A<->G, Y: C<->U). (B) To score differences in the protein seryl-tRNA synthetase. For example, both nucleotide (nuc) and amino acid (aa) sequences were compared across the two species. The nucleotide differences between species was scored as neutral if the resulting amino acids were the same, labelled Degeneracy. Biochemically neutral variation, labelled BANP, classed the following groups of replacements as neutral (Basic (H,R,K), Acidic (D,E), Non-polar (F,L,W,P,I,M,V,A) or Polar (G,S,Y,C,T,N,Q)) or if amino acids replacements were assigned a non-negative score in the BLOSUM score matrix Henikoff & Henikoff, 1992. (C) The proportion of near-neutral mutations for each RNA or protein was compared for different models of neutrality across deep and shallow phylogenetic distances for RNAs and proteins. The x-axis labels are described above.
Presuming that molecules surveyed were still functional in both species, these results tabulate all variations that preserved function of the molecules In both conserved and less conserved RNAs, of all the functional mutations, secondary structure was preserved more than biochemistry (Figure S2B). In proteins, biochemistry of the coded amino acid was preserved more than other traits (Figure S2B). This may reflect that, as functional molecules diverge, changes in one part of the molecule allow for compensatory change in other regions, which increases the overall diversity. Each divergent nucleotide (mutation) was further scored as presumed neutral or not, depending on whether it preserved secondary structure (RNA), amino acids (protein) and/or biochemistry (RNA or protein) (Figure S2A). Near-neutral protein biochemistry was scored using two metrics. BLocks SUbstitution Matrix (BLOSUM) is based on the frequency of one amino acid substitution for another in related proteins. A near-neutral BLOSUM mutation would be one that has a positive score; thus, is a common substitution during evolution Henikoff & Henikoff, 1992. BANP categorizes all amino acids as either basic, acidic, nonpolar or polar. A near-neutral BANP mutation would be one where the amino acid stays in the same category.
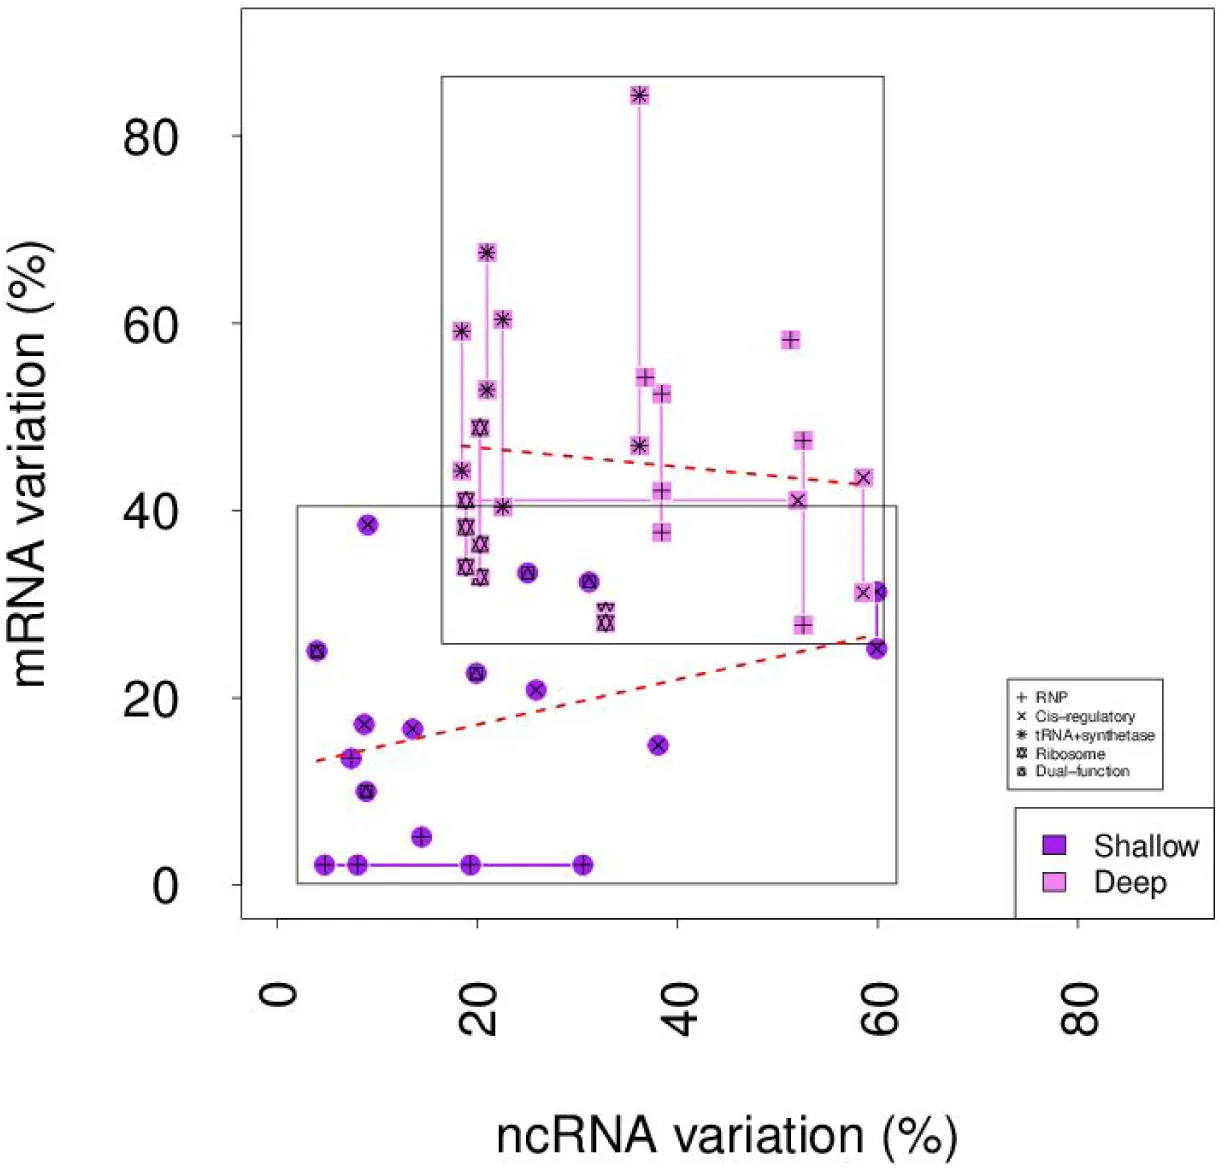
Figure 5:Level of nucleotide variation in interacting RNA and protein pairs.
Interacting RNA and protein pairs were compared across E. coli and S. enterica (Shallow) and E. coli and N. meningitidis (Deep). The nucleotide sequence for each RNA-protein pair was scored as the percentage of their respective nucleotide sequence that varied between the species, which gave the percent nucleotide variation. Partners were grouped according to function. No overall correlation (Spearman’s correlation) was evident between the variation in one molecule and its interacting partner is evident in either the Deep (Rho = −0.08, p = 0.70) or Shallow (Rho = 0.35, p = 0.16) groups, as calculated by Spearman’s Correlation.
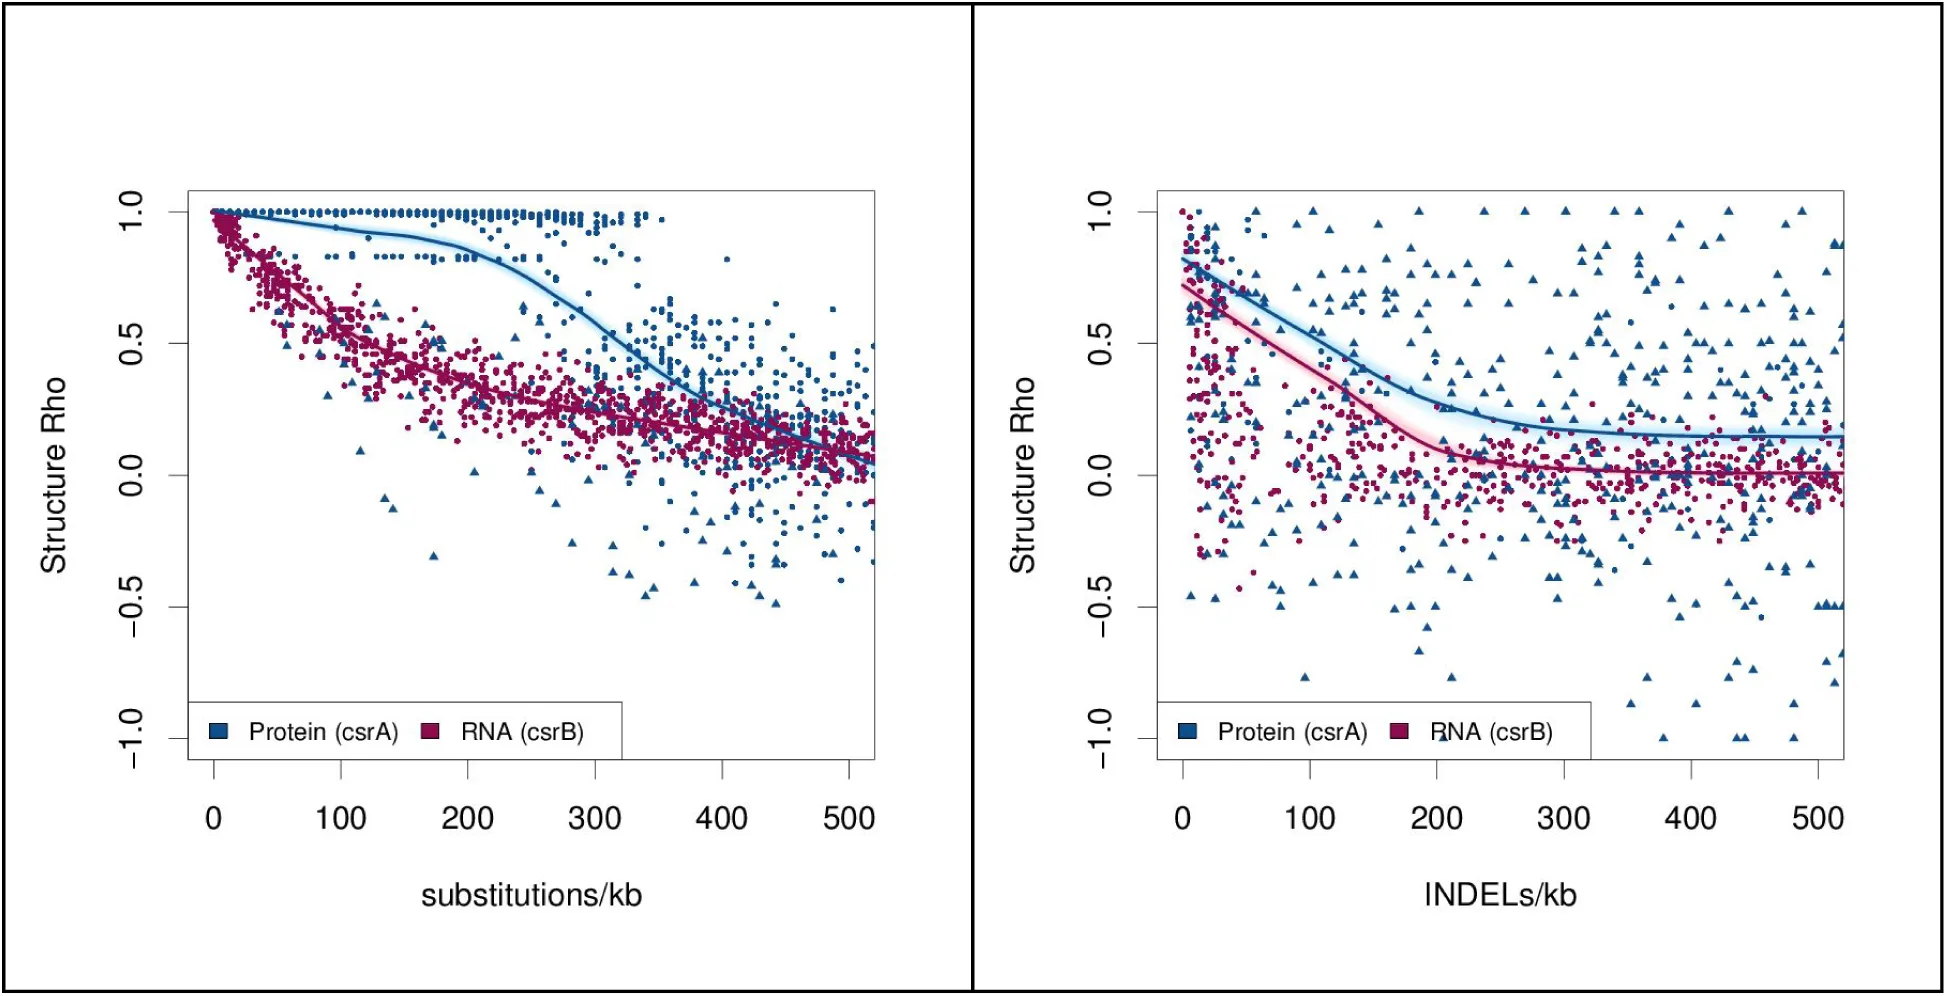
Figure 6:Structural robustness of the CsrA protein and CsrB sRNA.
Random mutants of the CsrA messenger RNA (blue) and CsrB small RNA (pink) were generated in silico. Their secondary structure probabilities were predicted using “RNAfold-p” and “PSSpred”. The per-residue probabilities of either base-paired/not-base-paired or alpha/beta/coil were compared between native and mutated sequences using Spearman’s correlation. This gave a “structure rho”, where 1 implies the predicted mutant structure is identical to the predicted parental structure, 0 means there is no correlation, and −1 shows a perfect inverse correlation. (A) Substitution mutations and (B) insertion or deletion mutations (indels) were introduced into the RNA (pink) and protein (blue) at rates ranging from 1 to 500 mutations per kilobase (kb). Points corresponding to truncated protein or small RNA with a length less than 75% that of the original are indicated with a solid triangle, otherwise a solid circle is used. Local polynomial regression (loess) curves were fitted to the RNA and protein points. To indicate the confidence for each loess curve, these were bootstrapped 500 times and plotted in light pink or blue to resampled points.
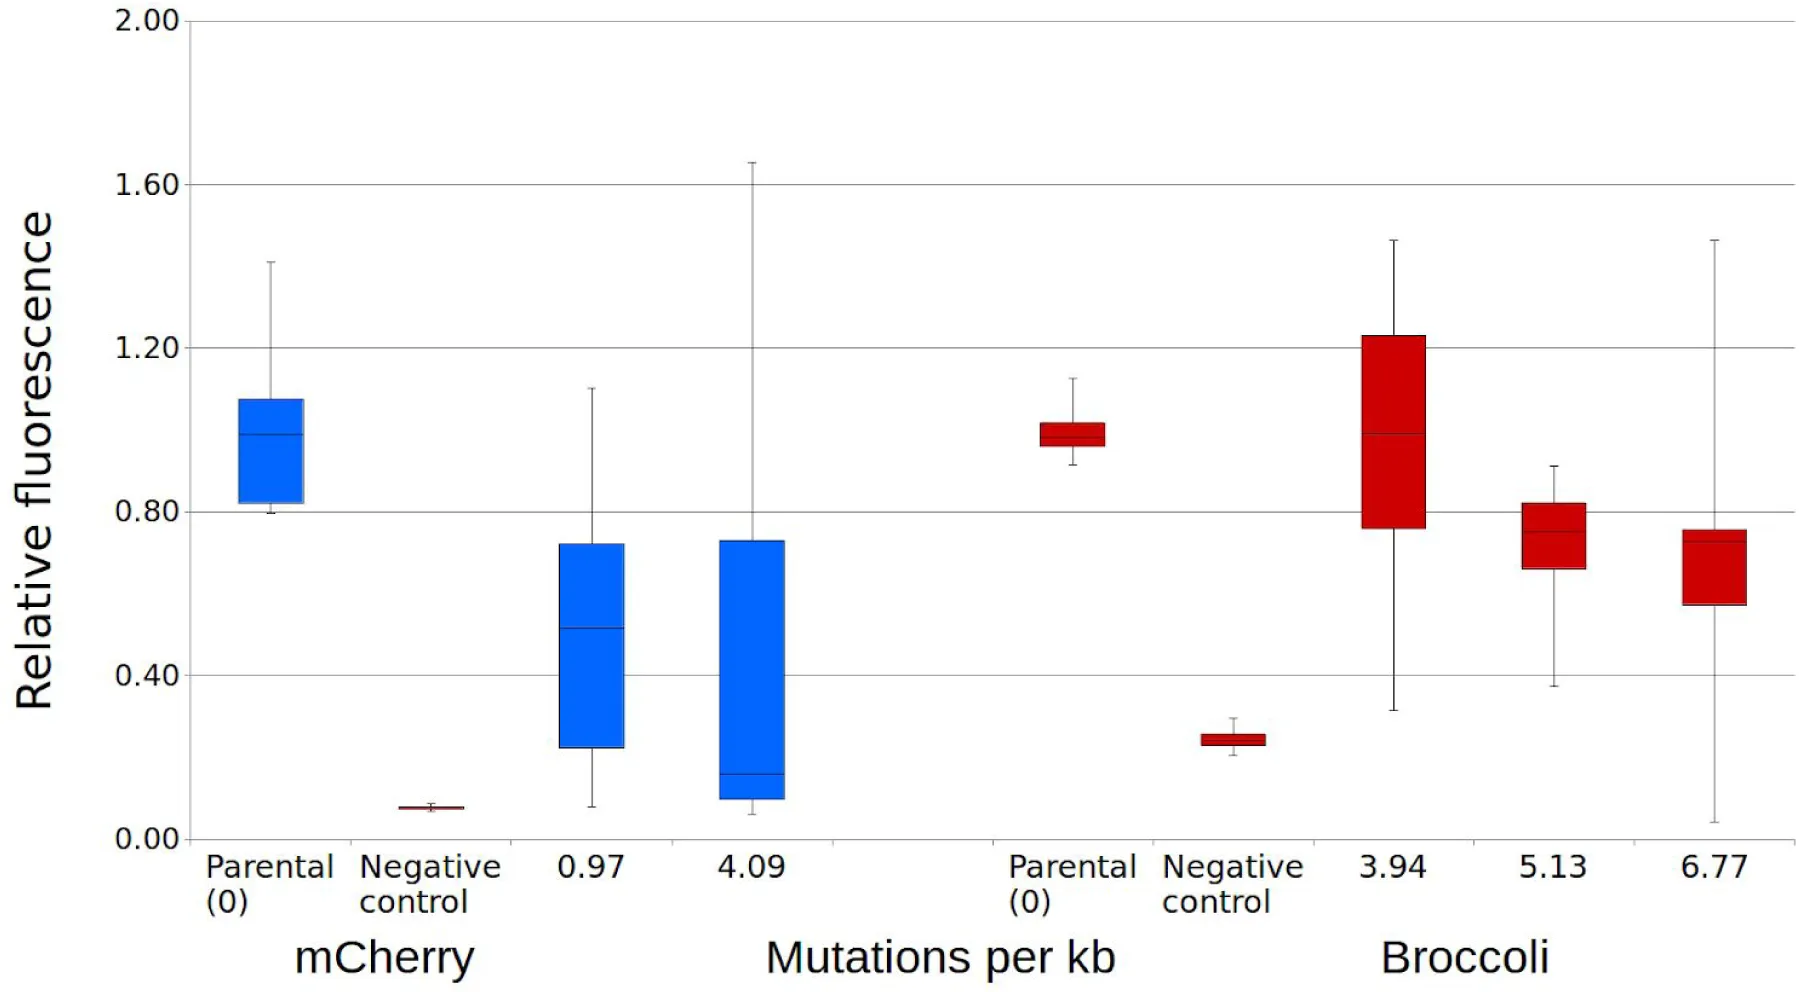
Figure 7:Fluorescence of mutant libraries of RNA aptamer Broccoli and protein mCherry.
Libraries of randomly mutated fluorescent RNA aptamer Broccoli and fluorescent protein mCherry were tested for function relative to the unmutated control. Two libraries of mCherry and three libraries of Broccoli were constructed, with using a range of mutation rates per kilobase (kb). The fluorescence intensities of the mutants were normalized to the optical density and the fluorescence intensities of unmutated controls.
Table 2:Conserved and Recent interacting RNAs and proteins
We thank Gabrielle David, PhD, for editing a draft of this manuscript.
Copyright © 2026 Coray et al. This article is distributed under the terms of the Creative Commons Attribution 4.0 International license, which enables reusers to distribute, remix, adapt, and build upon the material in any medium or format, so long as attribution is given to the creators.
- aa
- amino acid
- BLOSUM
- BLocks SUbstitution Matrix
- indels
- insertions or deletions
- kb
- kilobase
- mRNA
- messenger RNAs
- Wassarman, K. (2002). Small RNAs in bacteria: diverse regulators of gene expression in response to environmental changes. Cell, 109(2), 141–144.
- Bartel, D., & Chen, C. (2004). Micromanagers of gene expression: the potentially widespread influence of metazoan microRNAs. Nat Rev Genet.
- Jore, M., & others. (2011). Structural basis for CRISPR RNA-guided DNA recognition by Cascade. Nat Struct Mol Biol, 18(5), 529–536.
- Fischer, S., & others. (2012). An archaeal immune system can detect multiple protospacer adjacent motifs (PAMs) to target invader DNA. J Biol Chem, 287(40), 33351–33363.
- Marraffini, L. (2015). CRISPR-Cas immunity in prokaryotes. Nature, 526(7571), 55–61.
- Smith, A., Fuchs, R., Grundy, F., & Henkin, T. (2010). Riboswitch RNAs: regulation of gene expression by direct monitoring of a physiological signal. RNA Biol, 7(1), 104–110.
- Breaker, R. (2010). Riboswitches and the RNA World. Cold Spring Harb Perspect Biol, 4(2), a003566–a003566.
- Gilbert, W. (1986). Origin of life: The RNA world. Nature, 319(6055).
- Hoeppner, M., Gardner, P., & Poole, A. (2012). Comparative analysis of RNA families reveals distinct repertoires for each domain of life. PLoS Comput Biol, 8(11), e1002752.
- Lindgreen, S., & others. (2014). Robust identification of noncoding RNA from transcriptomes requires phylogenetically-informed sampling. PLoS Comput Biol, 10(10), e1003907.
- de Visser, J., & others. (2003). Perspective: Evolution and detection of genetic robustness. Evolution, 57(9), 1959–1972.
- van Nimwegen, E., Crutchfield, J., & Huynen, M. (1999). Neutral evolution of mutational robustness. Proceedings of the National Academy of Sciences, 96(17), 9716–9720.
- Fontana, W., & others. (1993). RNA folding and combinatory landscapes. Phys Rev E Stat Phys Plasmas Fluids Relat Interdiscip Topics, 47(3), 2083–2099.
- Kimura, M. (1984). The Neutral Theory of Molecular Evolution. Cambridge University Press.
- Leontis, N., Stombaugh, J., & Westhof, E. (2002). The non-Watson–Crick base pairs and their associated isostericity matrices. Nucleic Acids Res, 30(16), 3497–3531.